Well Being Indicators Explained and How to Track Them
You wake up feeling “fine,” then spend the day wondering why your focus is scattered, your patience is thin, and your evening energy disappears. A single question, “How am I really doing?”, often produces a vague answer because well-being isn't one feeling or one number.
Well-being indicators give that uncertainty structure. They act like a personal dashboard, helping you notice changes in mood, sleep, connection, focus, health, and daily circumstances before those changes blur together. Used thoughtfully, tracking isn't about judging yourself. It's about replacing guesswork with useful signals.
A short daily note can complement the benefits of logging by showing what happened, how you felt, and which conditions may have shaped the day. That can be especially useful for mindfulness practice, habit change, and careful self-observation around microdosing.
The idea also works at a national level. Governments and researchers use broad frameworks to understand whether people are healthy, secure, educated, connected, and satisfied with their lives. You can borrow that same logic without copying the entire system. A personal dashboard only needs a small set of meaningful indicators, recorded consistently and reviewed with curiosity.
Table of Contents
- Introduction to Well Being Indicators and Why They Matter
- What Well Being Indicators Really Mean
- The Four Families of Well Being Indicators You Should Know
- Common Measures and Scales Made Simple
- How to Choose and Track Well Being Indicators for Daily Life
- How to Read Your Results and Spot Real Patterns
- Pitfalls to Avoid and Your Next Steps Toward Better Tracking
Introduction to Well Being Indicators and Why They Matter
Suppose you begin journaling because you want to understand your energy. On Monday, you record low mood and poor sleep. On Tuesday, your mood improves, but you still feel mentally foggy. By Friday, you feel socially connected and focused, even though your sleep hasn't changed much.
Without a structure, these observations remain separate impressions. With well-being indicators, they become comparable signals. You can ask whether your mood changes with sleep, whether focus is better after meditation, or whether social contact protects your evening energy.
A dashboard instead of a verdict
An indicator doesn't tell you whether you're a good or bad person, and it doesn't define your health. It points to a condition worth noticing. A low mood score might reflect a difficult conversation, a demanding workload, insufficient rest, or something that deserves professional support. The number starts a conversation with yourself. It doesn't finish one.
Tracking also creates an early-warning system. A gradual decline in sleep, connection, or daily functioning may be easier to recognize in a log than in memory. At the same time, a stable pattern can reassure you that a new habit is fitting your life rather than merely feeling promising on one unusually good day.
Practical rule: Track to improve your questions, not to manufacture a perfect score.
This approach matters in mindfulness and microdosing contexts because expectations can influence perception. A structured record gives you a place to capture both positive and difficult experiences, including days when nothing obvious changes. It encourages observation over storytelling.
The path from national frameworks to personal use is straightforward. First, understand what an indicator measures. Then separate subjective experience from behavior and life conditions. Finally, choose a few signals, record them clearly, and interpret patterns across time rather than reacting to one entry.
What Well Being Indicators Really Mean
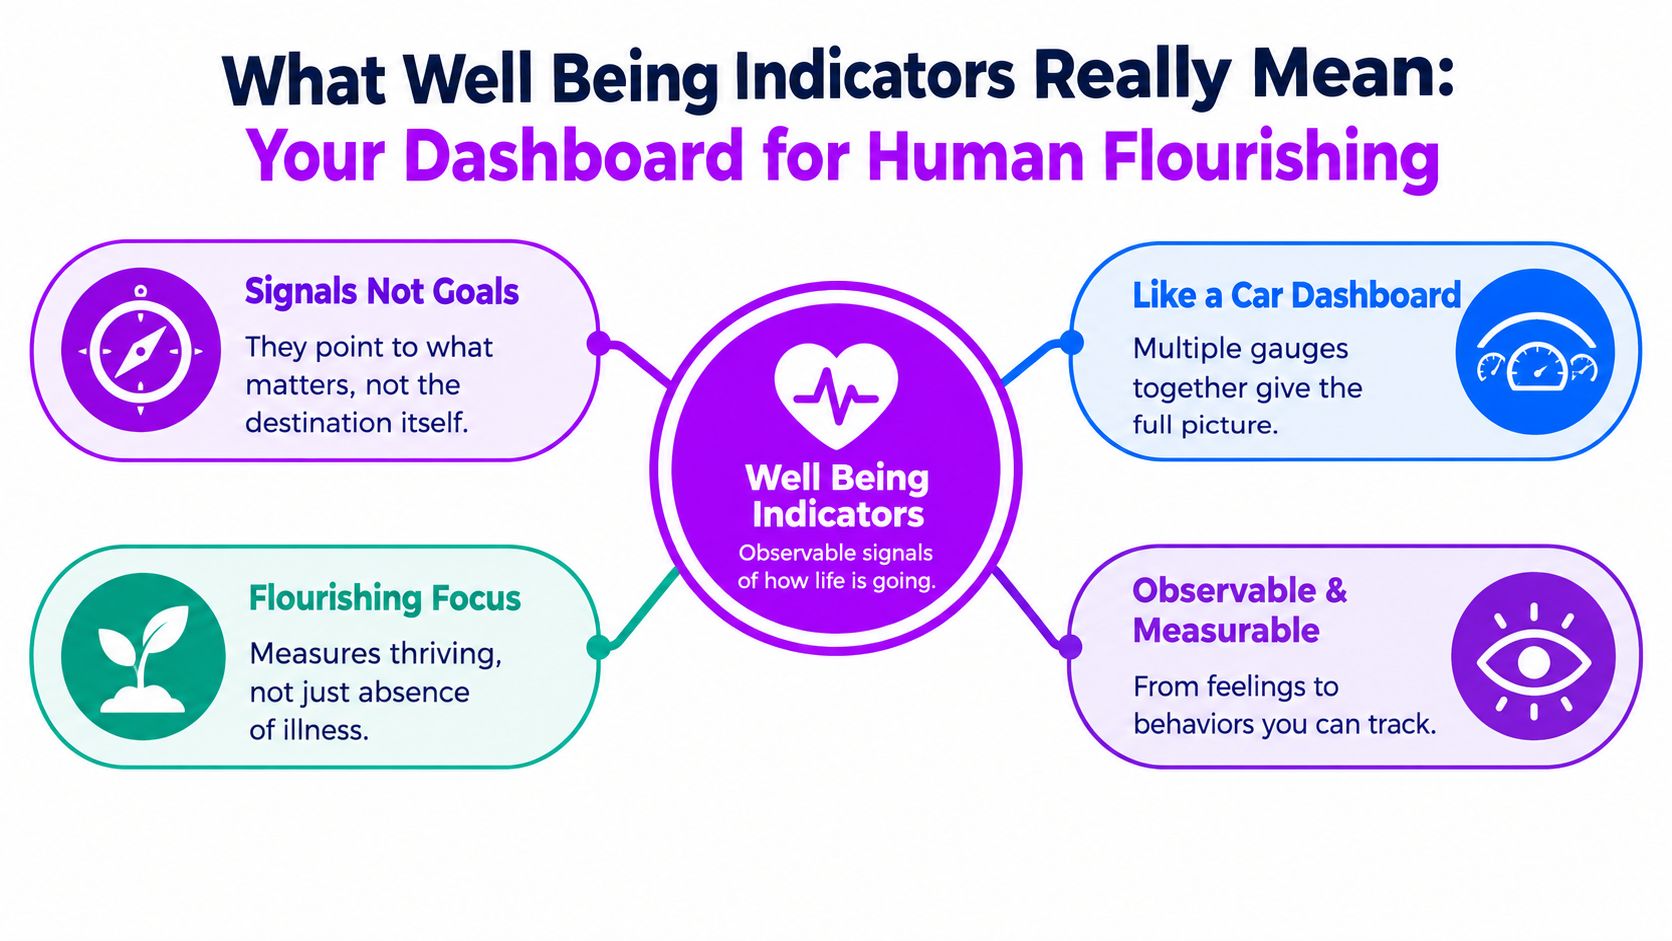
A well-being indicator is an observable signal of how life is going. It can describe an inner experience, such as life satisfaction, or an external condition, such as housing security. It can also describe an action or resource, such as sleep, time for leisure, social contact, or access to services.
Think of your car dashboard. The speedometer, fuel gauge, engine temperature, and warning lights don't measure the same thing. You wouldn't decide that the car is healthy because the fuel level looks good while ignoring an overheating engine. Well-being works similarly. One score can't show the whole picture.
From economic output to human flourishing
The modern idea of broad well-being measurement took shape in 1990, when the United Nations Development Programme introduced the Human Development Index in its first Human Development Report. The HDI was designed to move beyond GDP as the main measure of progress, combining health, education, and standard of living through measures such as life expectancy, schooling, and income per person. This historical account of the HDI explains why the framework became a durable way to compare human development rather than economic output alone.
That shift matters personally. A higher income may improve security, but it doesn't automatically mean better sleep, stronger relationships, meaningful work, or greater life satisfaction. A useful dashboard asks whether people have the conditions and experiences that help them function and flourish.
Current experience and future capacity
The OECD Well-being Framework separates current well-being from the resources that support future well-being. Its framework uses over 80 indicators to examine individual outcomes, how those outcomes are distributed across populations, and the natural, economic, social, and human capital that may sustain well-being over time. The OECD's 2024 overview shows why a single score can hide important causes.
For a person, current experience might be today's mood or sense of purpose. Future capacity might include a sustainable sleep routine, supportive relationships, physical health, financial resilience, and time for recovery. You need both views. Feeling good today doesn't prove that your routine is sustainable, while a difficult day doesn't erase long-term progress.
The Four Families of Well Being Indicators You Should Know
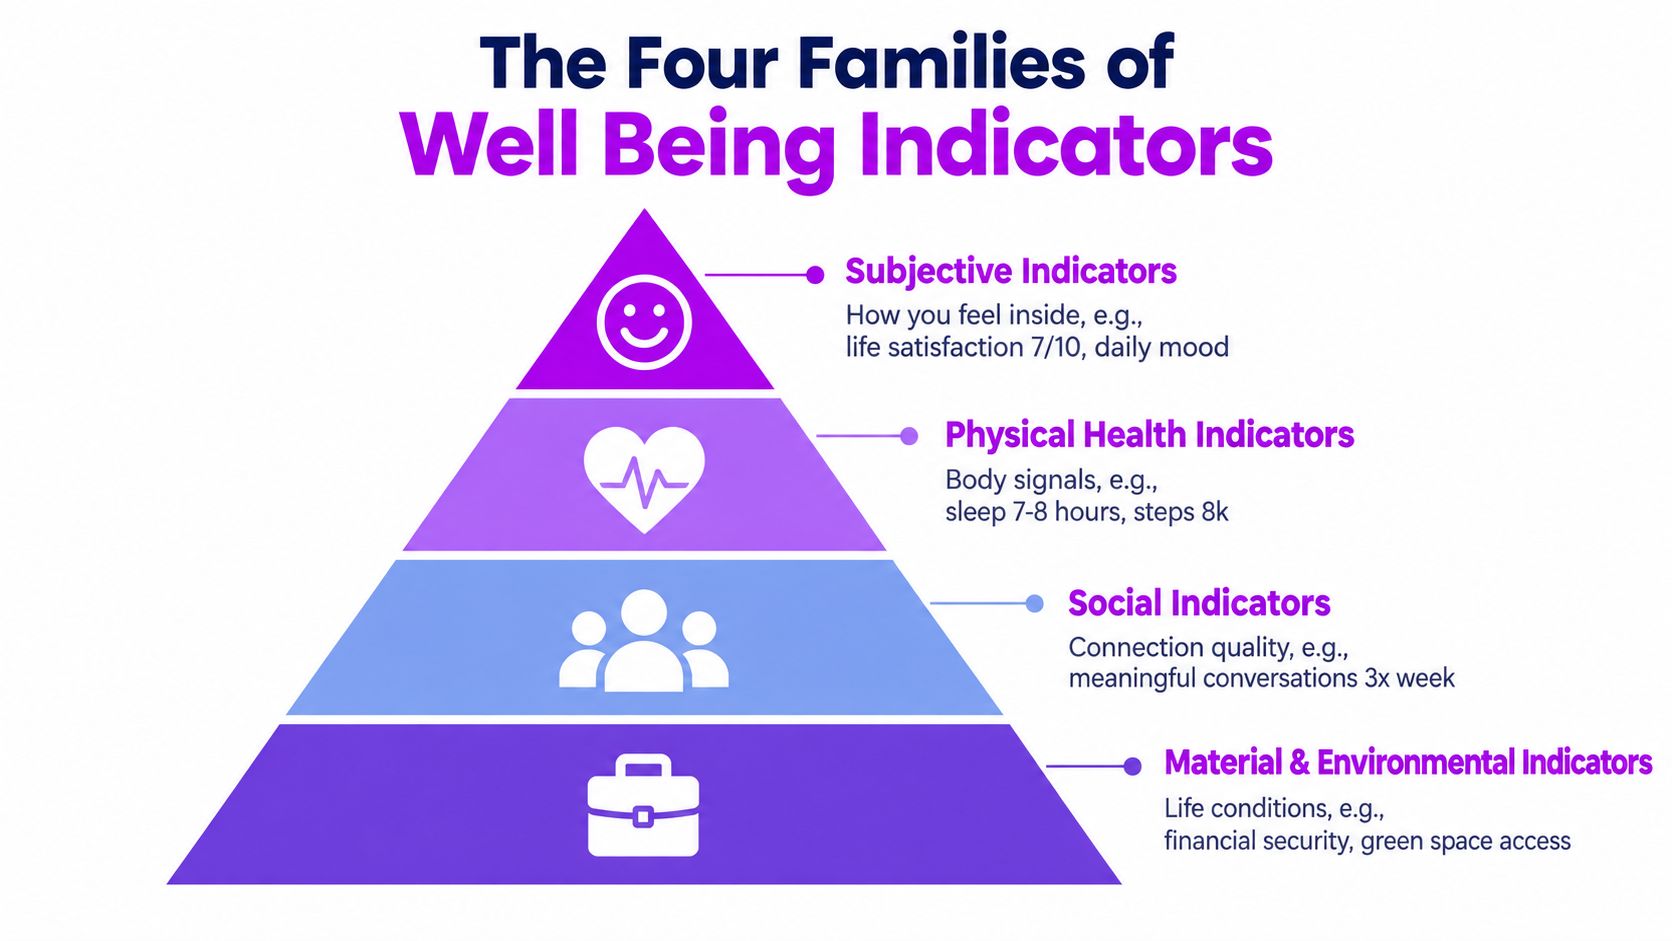
A balanced personal dashboard usually draws from four families. Each family answers a different question, and each has blind spots when used alone.
Subjective indicators
These describe how life feels from the inside. Examples include life satisfaction, daily mood, calmness, stress, purpose, and perceived connection. They're valuable because two people can face similar circumstances while experiencing them differently.
Their limitation is recall and context. Your rating may depend on the moment you answer, the question's wording, or a recent event. Subjective measures shouldn't be dismissed for that reason. They work best when recorded in a consistent way and paired with other signals.
Physical and behavioral indicators
Sleep duration, sleep quality, movement, appetite, energy, and body sensations provide clues about daily functioning. They can reveal a pattern that mood alone misses. You may report feeling positive while your sleep deteriorates, or feel low while your body is recovering from an unusually demanding day.
Behavioral data still needs interpretation. More movement isn't automatically better, and a longer sleep period may not mean more restorative sleep. Treat these measures as context, not as moral grades.
Social indicators
Social well-being includes the quality of relationships, meaningful conversations, trust, loneliness, and participation in community life. A busy social calendar can coexist with loneliness if interactions don't feel supportive. Conversely, a quiet day may feel nourishing when it includes genuine connection or restorative solitude.
Social indicators often explain changes in mood and resilience, but they can be sensitive to circumstances outside your control. Use them to notice needs, not to pressure yourself into constant activity.
Material and environmental indicators
Income, wealth, housing, employment, safety, environmental quality, and access to services shape the choices available to people. The OECD Better Life Initiative organizes well-being across 11 dimensions, including income and wealth, housing, work and job quality, health, knowledge and skills, environmental quality, subjective well-being, safety, work-life balance, social connections, and civic engagement. Its dashboard covers 80+ indicators, as shown in the OECD Better Life data explorer.
You won't track all of these personally. The lesson is to avoid treating mood as the whole story. If your mood is low, check whether the surrounding conditions, body signals, and relationships offer an explanation.
Common Measures and Scales Made Simple
Measurement turns a personal impression into something you can compare. The number isn't valuable because it looks scientific. It's valuable because you define it clearly, use it consistently, and understand what it can and can't tell you.
Evaluative measures
The OECD measures life satisfaction on an 11-point scale from 0 to 10, where 0 means “not at all satisfied” and 10 means “completely satisfied.” The OECD description of life satisfaction and work-life balance also operationalizes work-life balance through time allocated to leisure and personal care, measured in hours per day among people in full-time employment.
For personal use, write the anchors down. For example, 0 might mean “life feels unmanageable today,” 5 might mean “mixed and ordinary,” and 10 might mean “satisfied and aligned.” Your anchors don't need to match anyone else's. They need to remain stable enough that a 7 means roughly the same kind of experience each time.
Emotional and eudaimonic measures
Life satisfaction asks for a broad evaluation. Affect measures ask what emotions you experienced, such as calm, joy, irritation, or anxiety. These can respond quickly to short-term events. Eudaimonic measures examine purpose, meaning, engagement, growth, and whether your activities feel worthwhile.
Domain satisfaction adds another layer. You might rate work, relationships, health, and personal time separately. That prevents a strong area from masking a struggling one.
Technical guidance supports combining these forms rather than relying on life satisfaction alone. A review in BMJ Open's well-being measurement research identified 99 adult well-being measures spanning 196 dimensions, grouped into mental, social, physical, spiritual, functioning, and personal-circumstance domains.
Health-adjacent and behavioral measures
The OECD's 2025 update added self-assessed mental health, PHQ-4 for depression and anxiety risk, and WHO-5 for positive mental health to its subjective well-being guidance. These tools illustrate an important principle: different measures detect different pathways, and a mood score shouldn't substitute for a clinical assessment.
| Indicator Type | Example Measure and Scale | What It Best Captures |
|---|---|---|
| Life evaluation | Life satisfaction, 0 to 10 | Broad judgment about how life is going |
| Emotional experience | Positive and negative affect ratings | Short-term emotional conditions |
| Purpose and meaning | Agreement or reflection prompts | Engagement, values, and flourishing |
| Domain satisfaction | Separate ratings for work, health, or relationships | Which life area needs attention |
| Mental-health-adjacent screening | PHQ-4 or WHO-5 | Risk signals or positive mental health, not diagnosis |
| Time use | Leisure and personal care in hours per day | Recovery and work-life balance |
A simple daily mood rating scale can be enough to begin. Add one behavioral measure, such as sleep quality, and one connection or purpose prompt if those areas matter to your goal.
How to Choose and Track Well Being Indicators for Daily Life
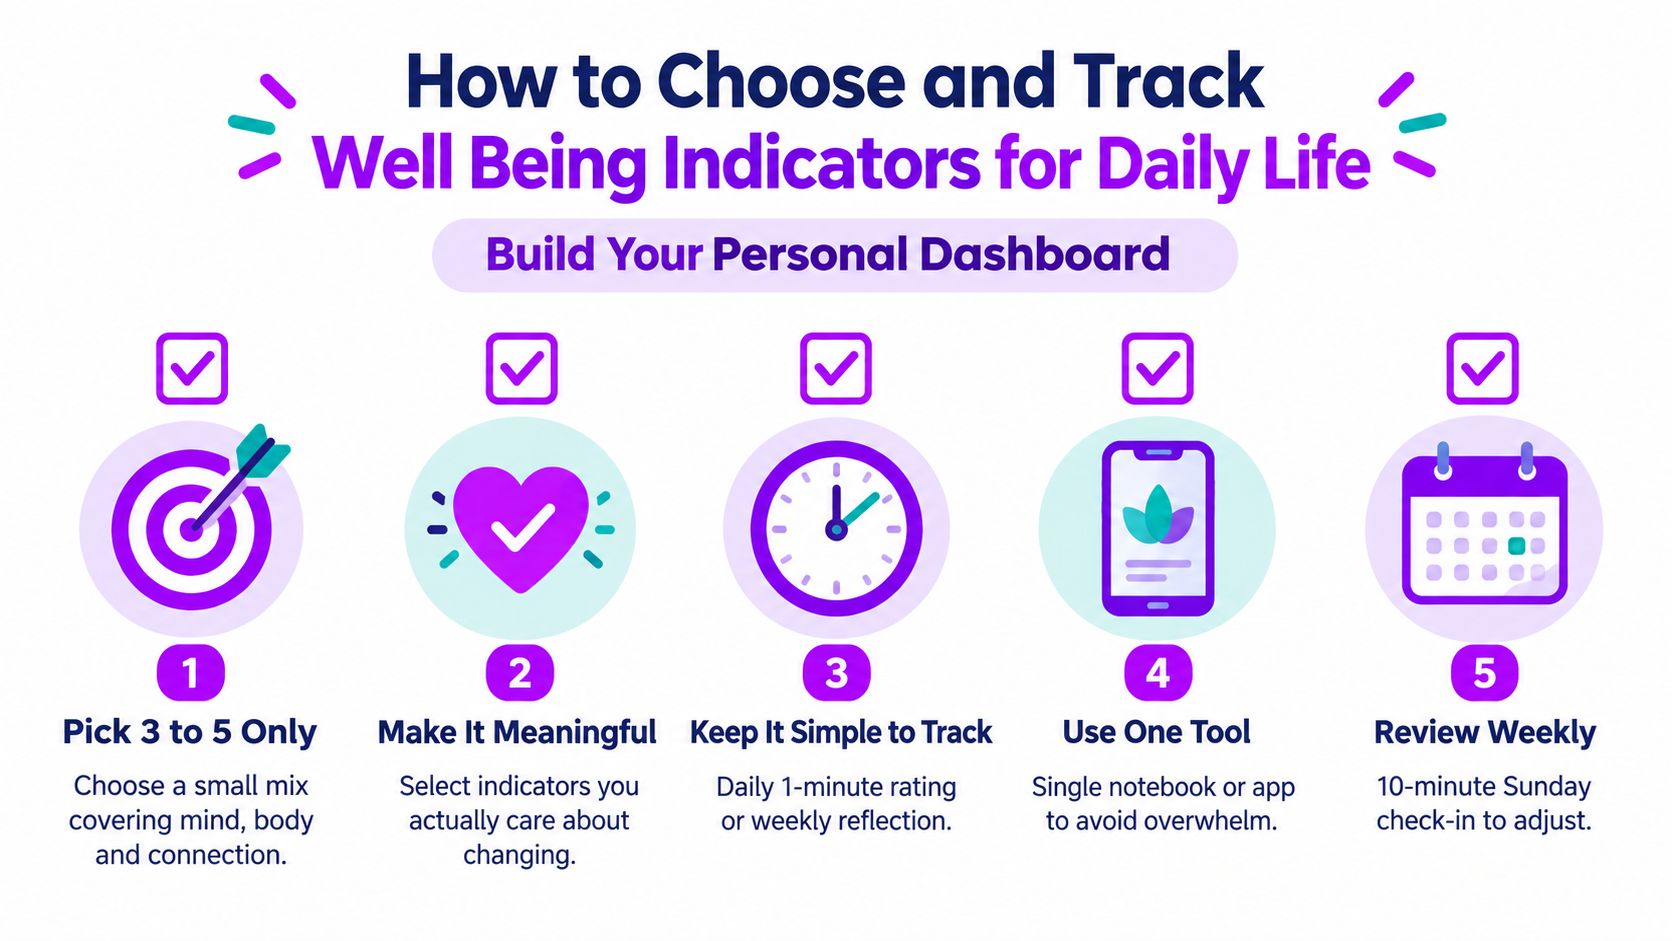
A personal dashboard should feel light enough to use on an ordinary day. Start with three to five indicators, not a replica of a national statistical system. Choose signals that connect directly to a question you care about, such as “Does this routine support my focus?” or “What helps me feel more grounded?”
Build a small mix
A useful starting set might include:
- Inner experience: Mood on a 10-point scale, plus a one-word emotional label.
- Body signal: Sleep quality, energy, or notable body sensations.
- Functioning: Focus, task completion, or ease of starting routine work.
- Connection: Meaningful social contact or felt loneliness.
- Reflection: A brief note about what supported or disrupted the day.
For mindfulness, you might record calm before meditation and calm later in the day. For microdosing, you could log dose details in one phase, then add a later reflection about mood, sleep, focus, and body sensations. Keep observations separate from conclusions. “Felt more focused after lunch” is more useful than “the dose worked.”
Choose a rhythm you can repeat
Daily measures should take about a minute. A weekly review can hold the more thoughtful questions:
- What changed across the week?
- Which indicator moved with the change?
- What context might explain it?
- What single adjustment is worth testing next?
If you're following a schedule such as Fadiman's 1-on/2-off or the Stamets 4-on/3-off approach, record the schedule and any deviations so you don't confuse protocol days with ordinary variation. These schedules aren't proof of safety or effectiveness, and people considering microdosing should account for health conditions, medications, legal status, and professional medical advice.
Use one notebook, spreadsheet, or app rather than scattering entries across multiple places. MicroTrack is one option that supports a 10-point mood scale, two-phase entries, protocol schedules, searchable history, trend visualizations, and CSV export. Whatever tool you choose, privacy and control over your data should be part of the decision.
A practical daily template is simple: date, sleep quality, mood, focus, connection, relevant context, and a short evening reflection. Don't add a field unless you know how you'll use the answer.
How to Read Your Results and Spot Real Patterns
A tracking system becomes useful when it helps you distinguish signal from noise. One unusually good morning or one difficult evening can't establish a pattern. Look across repeated entries, then check whether several indicators move together.
Start with trends
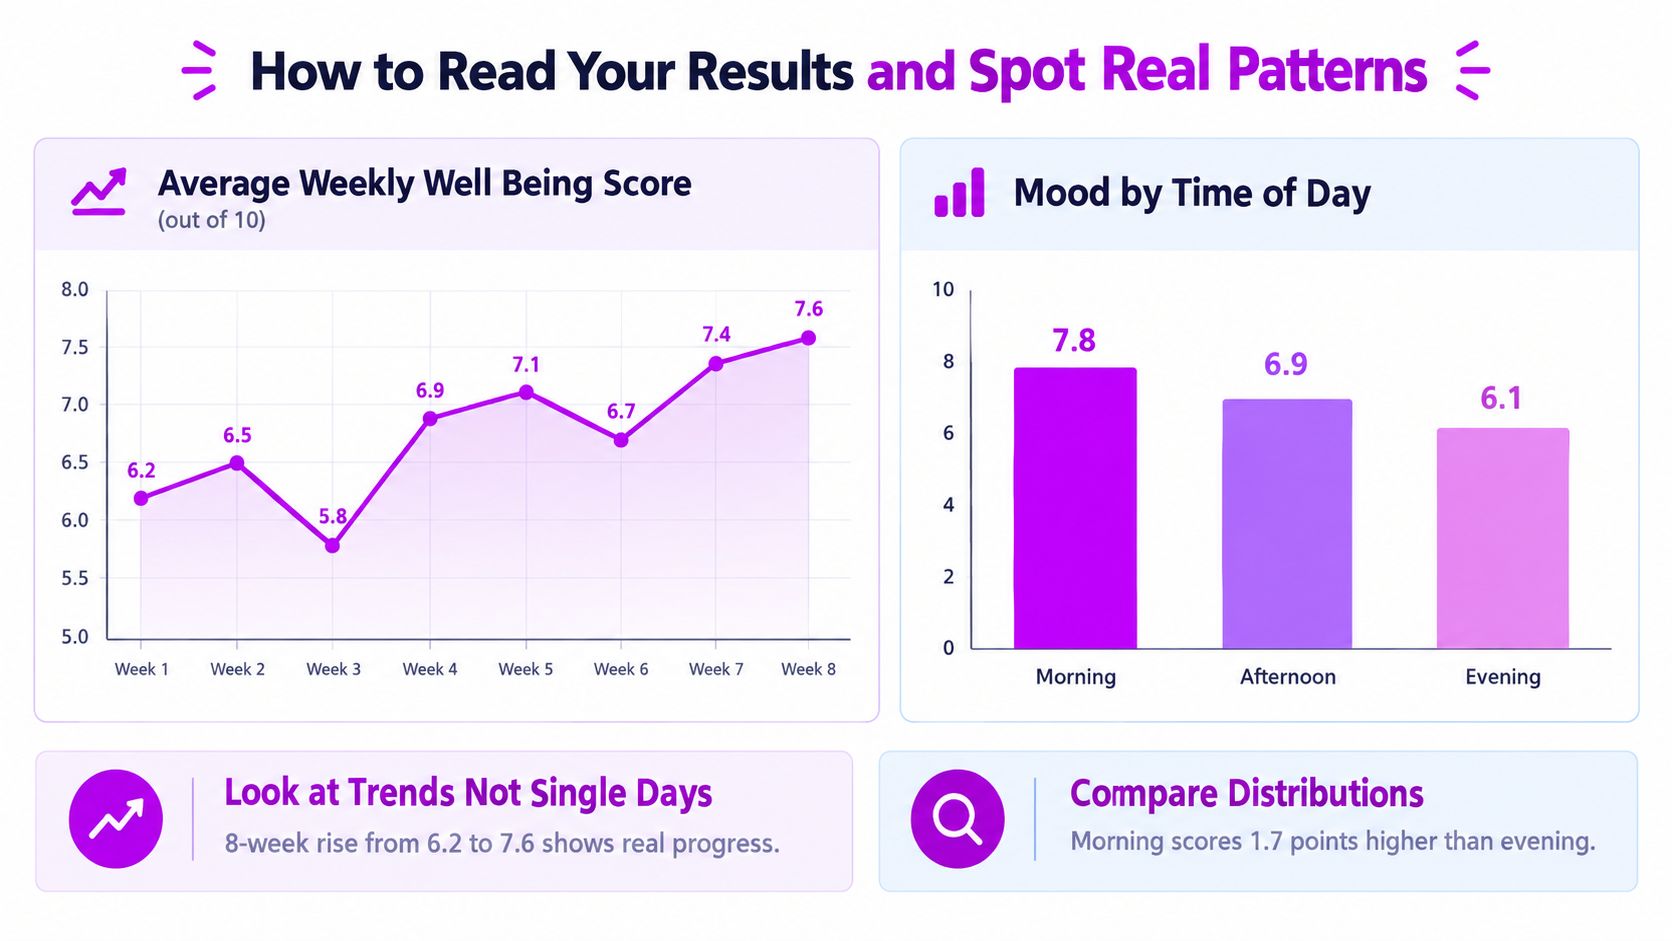
A line chart can show whether your average weekly experience is broadly stable, rising, or falling. The example visual shows an eight-week movement from 6.2 to 7.6, with fluctuations along the way, including a dip to 5.8 and later readings above 7. That shape teaches an important lesson: progress can contain difficult days.
For your own data, review weekly averages or another consistent summary. Keep the original entries visible, because averages can hide an important difference between steady moderate days and highly variable ones. Trend analysis for personal logs can help you frame this review without treating every movement as meaningful.
Compare distributions and contexts
Averages answer “how much,” but distributions answer “when” and “under what conditions.” The example chart compares mood by time of day, with 7.8 in the morning, 6.9 in the afternoon, and 6.1 in the evening. Your own version might compare workdays with weekends, meditation days with non-meditation days, or protocol days with rest days.
Cross-check related indicators before drawing a conclusion. If mood rises while sleep worsens, the apparent improvement may carry a cost. If focus improves but loneliness remains unchanged, the routine may be helping one domain without addressing another.
Write down context beside unusual entries. Illness, conflict, deadlines, travel, caffeine, medication changes, and social events can all affect interpretation. Your dashboard should help you ask better questions, not encourage certainty that the data can't support.
Pitfalls to Avoid and Your Next Steps Toward Better Tracking
The most common mistake is treating well-being as a single score. A high mood rating can coexist with poor sleep, low connection, or growing stress. A low rating can reflect one painful event rather than a lasting decline. Multiple modest indicators create a more honest picture.
Inconsistent timing creates another problem. If you rate mood in the morning on some days and late at night on others, the results may reflect time of day rather than a meaningful change. Choose a repeatable moment, or record the time so you can compare like with like.
Keep measurement proportionate
Over-tracking can turn self-reflection into a burden. Start with a small dashboard and remove fields you aren't reviewing. A weekly check-in should lead to one practical adjustment, not an elaborate investigation into every variable in your life.
Pay attention to signals that broad frameworks can miss in daily practice. Loneliness, depression risk, sleep, and functioning may matter more to an individual than a general life satisfaction score. The OECD's updated guidance reflects this measurement gap by including mental-health-adjacent measures, while national dashboards in the UK and Ireland have continued adding items such as loneliness, depression, and unmet medical need.
A useful log is one you can keep when motivation is low.
Protect the record as well. Use a private tool, understand whether data is encrypted, and look for export and deletion controls. A CSV export can preserve your history if you change tools, while searchable entries make it easier to revisit the context behind a pattern.
Start today with this compact template:
- Mood: 0 to 10, using your own written anchors.
- Sleep: quality or duration, recorded consistently.
- Focus or functioning: a brief rating.
- Connection: connected, neutral, or lonely.
- Context: one sentence about anything unusual.
Review it after a week, then decide whether one additional indicator would answer an important question. If tracking raises concerns about depression, anxiety, sleep disruption, medication interactions, or worsening functioning, use the log as a prompt to speak with a qualified health professional rather than attempting to diagnose yourself.
MicroTrack gives you a private space for structured microdosing and mindfulness logs, including mood, sleep, energy, body sensations, reflections, schedules, and trend views. Start with the small dashboard above, keep your entries consistent, and visit MicroTrack to begin tracking without a credit card, streaks, or gamification.