Pattern Recognition Examples: 8 Signals Worth Trusting
Is that three-day slide in your mood a real change, or just a bad week?
Anyone who tracks mood, sleep, dose timing or workouts eventually makes a decision off a chart. Cut the dose. Shift the timing. Stop entirely. The decision feels data-driven because there's a graph on the screen. A graph is a record of what happened while a dozen other things were also happening.
That gap is what this list is about. The eight pattern recognition examples below come from manufacturing, email, recommendation engines, card fraud, medical imaging, cardiology, clinical psychology and single-person trials. Each one solved a version of the same problem, telling signal from noise. Each ends with something you can do this week with your own logs.
One ground rule before the list. Recognizing a pattern is an observation. It isn't evidence of a cause, no matter how clean the chart looks. Nearly every failure mode below comes from skipping that distinction.
Table of Contents
- 1. Statistical Process Control Charts (Shewhart Control Charts)
- 2. Bayesian Spam Filtering
- 3. Collaborative Filtering Recommendations (Netflix Prize)
- 4. Credit Card Fraud Detection
- 5. Deep Learning for Diabetic Retinopathy Screening
- 6. Deep Learning for ECG Arrhythmia Detection
- 7. Ecological Momentary Assessment and Mood Pattern Detection
- 8. N-of-1 Trials and Single-Person Analysis
- 8 Pattern Recognition Examples at a Glance
- From Spotted Patterns to Tested Conclusions
1. Statistical Process Control Charts (Shewhart Control Charts)
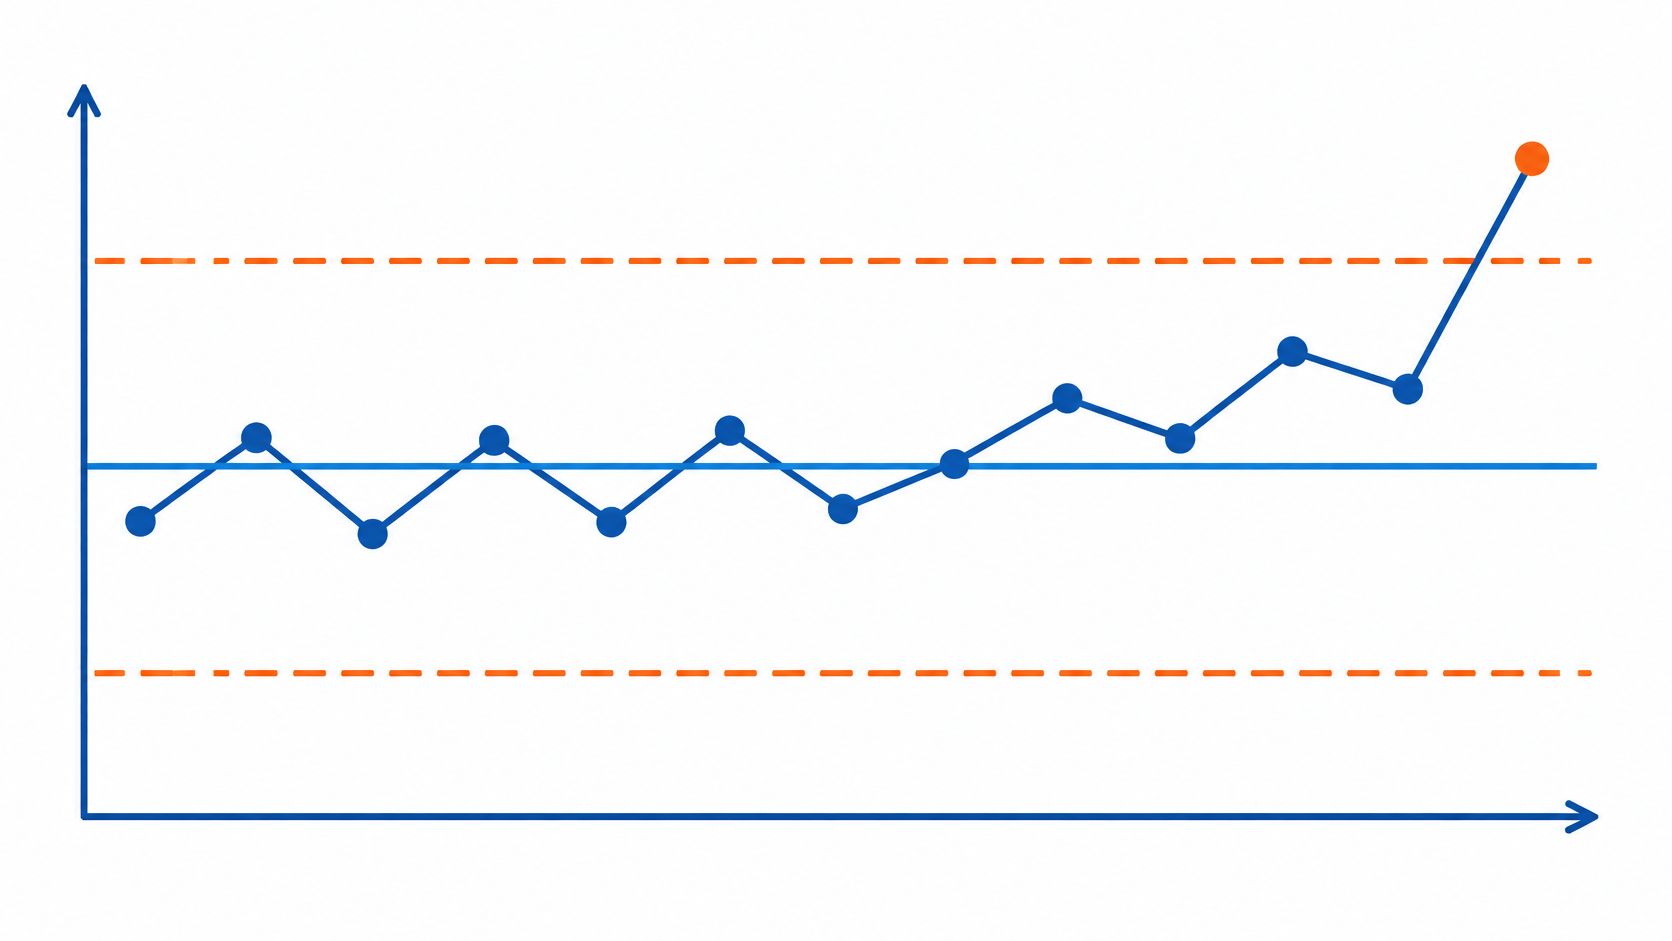
A machinist measures parts off a line every hour. The diameter drifts up a few microns, back down, up again. None of those readings is scrap. Then seven points in a row land above the centerline, and the cutting tool is about to fail.
That's the logic Walter Shewhart built at Bell Labs in the 1920s, and it's still the backbone of quality management. A control chart plots values in time order and draws upper and lower limits from the process's own variation, not from a target somebody picked.
What the limits are actually for
Inside the limits, you're looking at routine noise. A run of points on one side, a steady trend, or a single point outside the limit is a signal worth investigating. The chart never tells you why the tool drifted. It tells you the drift is unlikely to be ordinary variation, so stop and look.
Hospitals use the same method on run charts for infection rates and wait times after a process change. A personal dashboard can run a small version of it and flag a sustained drop in mood ratings rather than one rough Tuesday.
Thresholds decide how many signals you get. A University of Eastern Finland paper on precision and recall makes the trade-off explicit, since lowering a selection threshold generally raises recall at the cost of precision. Set a low bar and you'll catch every wobble, most of them meaningless.
The transferable rule: draw your limits from a stretch when nothing unusual was happening, and recalculate them only after you deliberately change your practice.
Build a baseline before you read a trend. Wait for two to four weeks of consistent logging before judging anything. React to sustained runs, not isolated points. Write sleep, stress and schedule changes next to the values so a flagged signal has an explanation waiting for it.
2. Bayesian Spam Filtering
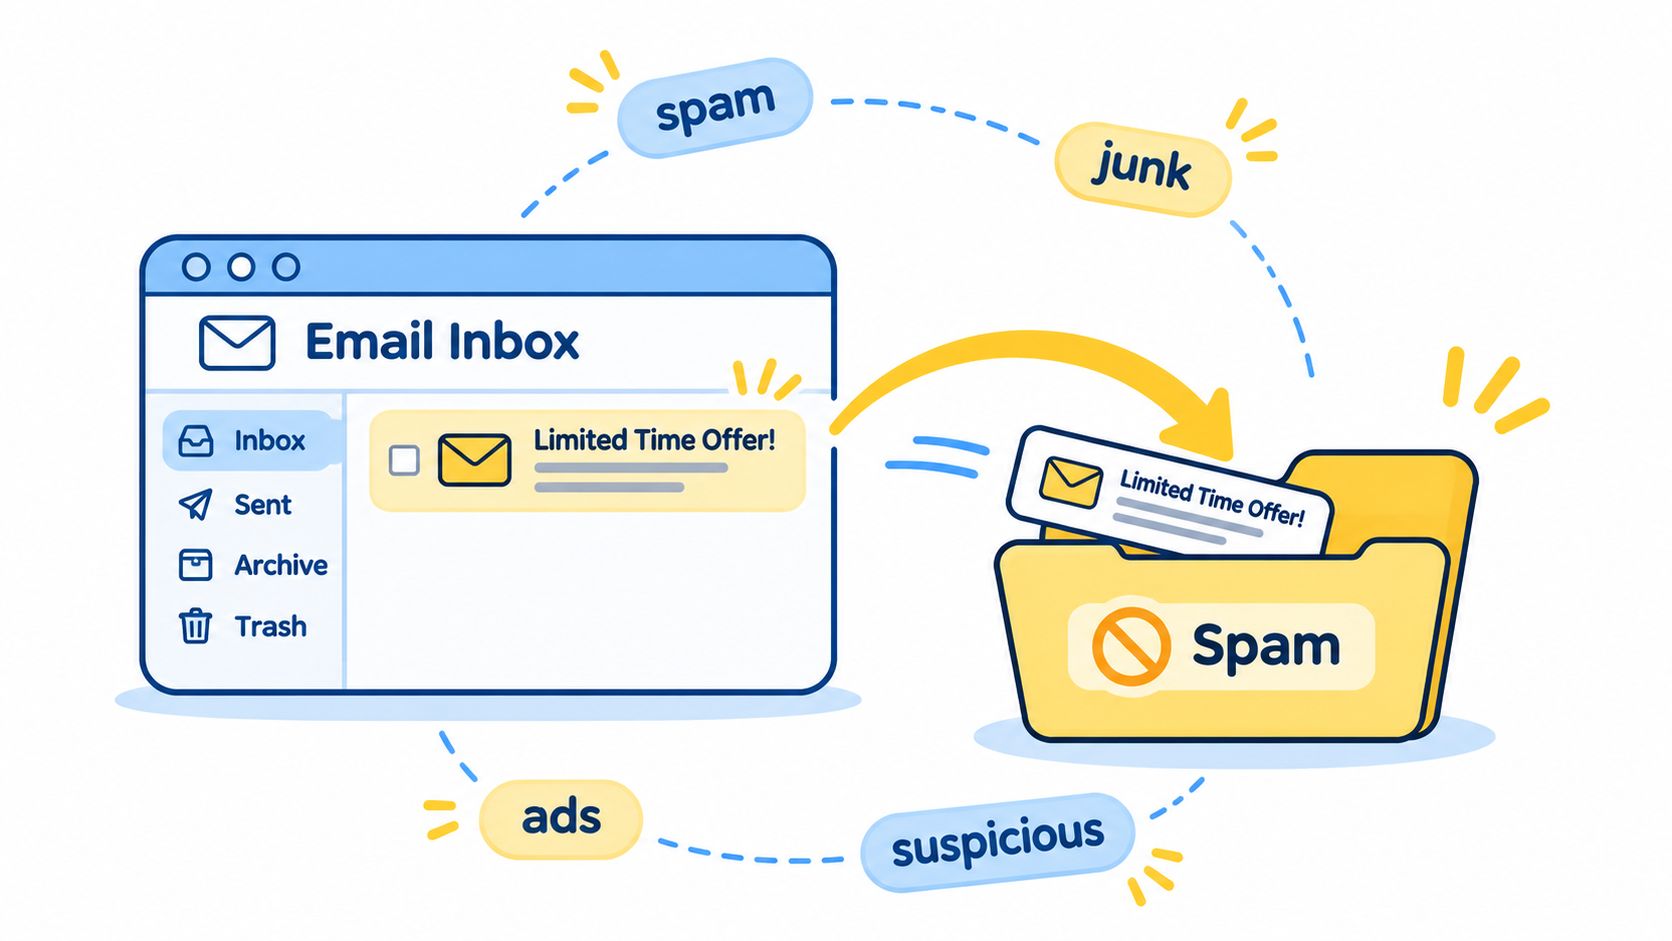
Spam filtering is a pattern recognition example that many people have helped train without realizing it. Every time you hit report spam, you label an example and the filter adjusts. No engineer rewrites the rulebook.
Paul Graham's 2002 essay "A Plan for Spam" made the approach famous. It scores a message by combining per-word probabilities learned from labeled spam and legitimate mail, so no human writes a rule about capital letters and exclamation marks. Corrections keep arriving, and the probabilities follow them.
The benchmark instinct behind that design is older than the internet. In the early 1960s, Bell Labs engineer Wilbur H. Highleyman assembled 2,300 alphanumeric characters, roughly 1,800 hand-printed and 500 machine-printed, and circulated them so competing methods could be compared on identical samples. A Springer analysis of that benchmark history describes it as possibly the first machine-learning benchmark, and the principle matters more than the count: performance gets measured against a common reference set, not against examples each researcher chose.
Why labeling beats rule writing
- Correct the classifier, not just the inbox. Marking a miss as spam is a training label. Doing it consistently teaches the filter your specific vocabulary.
- Audit the spam folder weekly. Filters that swallow receipts and password resets are over-tuned, and the false positives are invisible unless you look.
- Keep a few hard rules for high-confidence cases. Mail from your own domain or a known client doesn't need a probability score.
The same logic applies to a journal. A bad day you later trace to five hours of sleep is a labeled example. The label is worth more than the memory of the day.
3. Collaborative Filtering Recommendations (Netflix Prize)
The Netflix Prize ran from 2006 to 2009 with a one million dollar bounty for improving the company's rating predictions. It did more for matrix factorization than for anyone's DVD queue, and it turned a private product problem into a public benchmark that hundreds of teams attacked at once.
Collaborative filtering rests on a plain premise. Your ratings resemble those of people who rated similarly before, and items cluster by who liked them. The model learns latent factors nobody named, a taste for slow and gloomy character studies, from interaction data that is mostly empty.
Say a streaming service notices you finish every Nordic crime drama you start. That's a pattern in your behavior that you never stated as a preference. It's useful, and it isn't the same thing as a plan for your evening.
The benchmark that made a jump legible
Improvement only counts when everyone is scored on identical data. The 2012 ImageNet competition set 1,000 object categories with roughly 1.2 million labeled training images, plus 50,000 validation and 100,000 test images. AlexNet, a deep convolutional network, reached a top-five error rate of 15.3% against 26.2% for the second-place system, a gap of 10.9 percentage points, or about 42% relative, as a Multigrid write-up of the 2012 ImageNet result sets out.
- Treat recommendations as candidates. Check a suggestion against your stated goal before you follow it, whether that's a series to watch or a routine to try.
- Mix in explicit preferences. Collaborative signals go thin for anything new, so tell the system what you want.
- Watch for narrowing. A recommender that only shows you more of the same is optimizing for engagement, not for you.
The blind spot is worth naming. A recommender predicts what you'll do next, not what serves you. Your own logs have the same bias if you only review the entries that fit the story you already believe.
4. Credit Card Fraud Detection
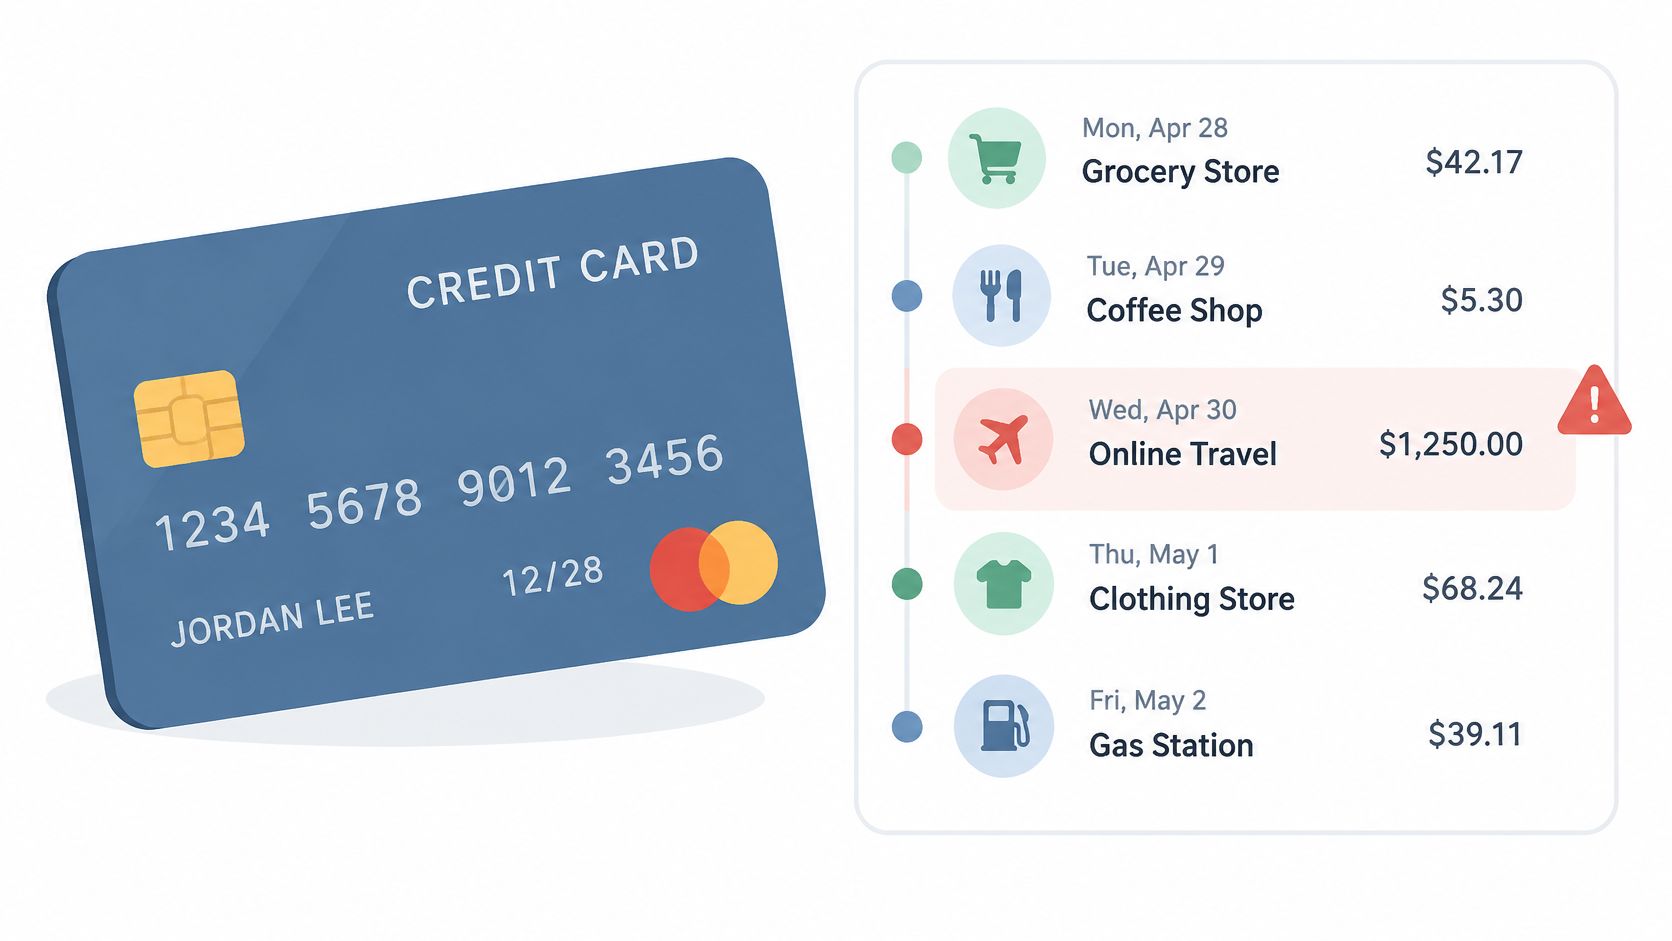
A card gets declined in a city the holder has never visited. Two hours later it works fine. Nothing was wrong with the account. The transaction landed a long way from the cardholder's learned pattern.
Fraud models differ in their internals, and FICO Falcon is one of the widely deployed scoring systems banks rely on. The shape is the same everywhere. Estimate what normal looks like for this account across amount, location, merchant type and time of day. Score each new transaction for deviation, then act at a threshold, inline, in the time it takes to authorize a purchase.
The boundary is a choice, not a fact
A classifier needs a decision boundary, and a Columbia University primer on statistical pattern recognition makes the useful point that the boundary comes from the distributions of each class, whether specified in advance or learned from data. Change the assumed distributions and different transactions get flagged. That's why a detector has to be validated on data it never saw during training, since a boundary can fit last year's fraud beautifully and miss next month's.
- Build a personal baseline first. Five weeks of logs beats a hunch about what counts as unusual for you.
- Treat a flag as a prompt to review. The decline isn't proof of fraud, and a detected mood pattern isn't proof of a cause.
- Note which feature moved. Time, place and amount are the card features. For you they're timing, dose, sleep and workload, and naming the one that shifted is most of the analysis.
A run of small test charges followed by one large purchase is the classic fraud signature. In your own records, the equivalent is a cluster of mediocre days that only looks obvious in hindsight. Both are worth checking and neither is self-explanatory.
5. Deep Learning for Diabetic Retinopathy Screening
A retinal photograph hides its evidence in plain sight. Microaneurysms, haemorrhages and exudates appear as small, low-contrast features, easy to miss at the end of a long clinic day, and a trained model can flag them with a consistency that volume alone tends to wear down.
Published studies have shown convolutional neural networks grading retinopathy at a level comparable to ophthalmologists, and regulators have since authorized autonomous screening systems that make the referral call without a clinician reading each image. Systems like these now run in primary care settings, which matters most where ophthalmologists are scarce. The question a model can answer at scale is "who needs a closer look," and that framing is worth borrowing for your own data.
An overview of AI-assisted retinal screening in practice:
What clinical validation actually documents
A good model and a trustworthy one are different objects. The difference is documented error. In NIST's testimony on facial recognition technology, the agency separates false positives, wrongly matching two different people, from false negatives, failing to match two images of the same person, and it evaluates accuracy, throughput, reliability and sensitivity to image and subject characteristics. Its assessment covered 189 algorithms from 99 developers using 18.27 million images of 8.49 million people, and it reported demographic and image-quality differences rather than one universal accuracy number. NIST also ties the false non-match rate to a threshold chosen for a specified false-match rate, which makes the operating point part of the published result instead of a footnote.
That is the standard to borrow when you read your own tracking data.
- Use screening as a referral step. A positive flag narrows where to look; it does not close the question. A detected pattern in your logs routes attention, nothing more.
- Ask which population a result came from. A model validated on one clinic's patients transfers poorly to another, and a personal baseline built during a quiet month misleads you during a heavy one.
- Keep results over time. A single reading is a data point. A series is a pattern.
This week, take one flagged pattern in your own records and write down its false positive: the ordinary explanation that fits the same data just as well.
6. Deep Learning for ECG Arrhythmia Detection
A watch taps your wrist and says your rhythm looked irregular. The alert came from a waveform, not a doctor, and it raises the question this whole list circles. How much should a detected pattern change what you do next?
Deep learning models trained on long single-lead ECG recordings now classify arrhythmias with accuracy comparable to cardiologists. That moves pattern recognition onto continuous signals collected outside a clinic, on sweaty wrists, in bad light, at three in the morning. The trade-off is real: the same model that detects a rhythm in noisy field data can also hallucinate structure in a corrupted strip.
Recognition fills gaps, and that cuts both ways
A single-lead strip is an incomplete picture. There's noise, dropped beats, movement artifact. Gestalt closure describes the visual system's habit of closing those gaps to perceive a whole object, and neural network research on Gestalt closure uses the Kanizsa triangle to show it, where separated fragments produce an illusory shape nobody drew.
Trained models do something similar with waveforms, and it works until the gap is exactly where the answer was. The practical test is to check a detector against both complete and deliberately fragmented input and measure where recognition breaks down. A model that scores well on clean recordings and falls apart on partial ones is telling you where its confidence ends.
Your own log works the same way. An app that fills in a missed night's sleep estimate or smooths a patchy mood series is closing gaps, not reading them. I treat any imputed value in tracked data as noise until a real reading confirms it.
Where the pattern stops: an irregular-rhythm alert is a triage signal. It tells you to get a proper read, not what the read will say.
Three habits carry over. Treat device alerts as reasons to see a clinician rather than diagnoses. Note symptoms and timing next to any recorded event, because context is what a cardiologist will ask for first. Bring the tracked data to the appointment, since a log of when your heart flipped is more useful than a memory of it happening.
7. Ecological Momentary Assessment and Mood Pattern Detection
Ask someone how their mood was last Tuesday and you'll get a story shaped by how the week turned out. Ask them at 2 p.m. on Tuesday and you get a number.
Ecological momentary assessment, formalized by Arthur Stone and Saul Shiffman in the 1990s, collects brief self-reports in the moment and in the person's own environment. Clinical research uses smartphone diaries to track depression and anxiety symptoms. Athletes and shift workers use the same method across training blocks. It reduces recall bias and captures how experience moves through a day.
The interesting question is what to do with the resulting series. Google's DeepMind team offers a working model from data centers, where they applied pattern recognition to thousands of operational sensor readings and control variables, using neural networks to predict how alternative cooling actions would affect future energy use, subject to explicit safety constraints. The DeepMind account of the data center cooling system describes a system that ranked actions by predicted effect rather than acting on any single signal.
That's the right frame for a mood log too. Treat a detected pattern as a constrained, probabilistic signal. Compare it against your own baseline, require a minimum number of observations, and show the window and confidence alongside it.
What a small, uneven dataset can honestly tell you
Most personal datasets are sparse, irregular and multimodal, mixing mood scores, dose timing, sleep and free text. As an Ailoitte overview of pattern recognition in AI agents notes, modern systems increasingly fuse images, text and audio and lean on self-supervised and synthetic data to compensate for thin labels. None of that makes a personal conclusion reliable on its own.
- Separate description from causation. "Mood was higher on days logged after 9 a.m." is a finding. "Morning dosing improved mood" is a claim nobody has tested yet.
- Flag patterns that lean on a handful of entries. Three good days is an anecdote with timestamps.
- Set a minimum window before you look. Automated pattern detection in your own data is most useful after weeks, not days.
8. N-of-1 Trials and Single-Person Analysis
The most useful thing one person can do with pattern recognition is run a small experiment and let the experiment decide what the pattern means.
N-of-1 trials alternate between treatment and control conditions, often in randomized and blinded order, and compare outcomes across the alternating periods. Clinicians developed the design to handle individual variation in response, the fact that a treatment working on average can still fail for a particular patient. The question shifts from whether something works in general to whether it works for this person.
Why blinding isn't optional
Expectation generates patterns all by itself. A 2026 systematic review of psychedelic microdosing in CNS Drugs found subjective and neurophysiological effects but minimal consistent effects on cognition, creativity or sustained mood, with reported improvements often not significantly different from placebo and mood benefits largely attenuated under blinded conditions, as the CNS Drugs review of microdosing evidence reports.
That is the finding most self-trackers need to sit with. The practice that feels meaningful may still be working through expectation.
A design worth stealing: change one thing at a time, and make the near-miss the interesting case.
Perception research runs on the same logic. Gestalt grouping holds that people read nearby elements as one group and cluster similar colors or shapes together, and the standard test is to change exactly one property, distance or alignment or mirror symmetry, then check whether the perceived grouping shifts. Visual reasoning tests apply the same principle with paired scenes: a positive case that satisfies a rule and a negative case that nearly satisfies it but breaks one constraint. The near-miss provides the key diagnostic information.
Apply the same discipline to your own log. Define the primary outcome and how you will measure it before you start. Use fixed alternating blocks instead of switching conditions when you feel like it. Allow washout periods where carryover is plausible. Keep the near-miss week, the block where conditions almost held but slipped, in the analysis rather than discarding it as messy data. And treat a couple of cycles as a working hypothesis about individual variation in your response: bring health decisions to a qualified professional rather than settling them with a spreadsheet.
Start this week. Pick one variable, define the outcome in advance, and run two alternating blocks before you read anything into the chart.
8 Pattern Recognition Examples at a Glance
| Item | Domain | Core Method | Key Strength | Main Limitation |
|---|---|---|---|---|
| Statistical Process Control Charts (Shewhart Control Charts) | Quality management and self-tracking | Plot time-ordered measurements against a centre line and control limits to detect meaningful shifts | Distinguishes genuine changes from routine variation | Needs sufficient stable data; assumptions may not fit subjective measures |
| Bayesian Spam Filtering | Email classification | Uses Bayes' theorem to combine token probabilities learned from labeled messages | Adapts to new spam patterns with user feedback | Vulnerable to obfuscation, poisoned training data, and false positives |
| Collaborative Filtering Recommendations (Netflix Prize) | Media and e-commerce recommendations | Finds patterns in user-item interactions using methods such as matrix factorization | Reveals non-obvious preferences without detailed item descriptions | Cold-start problems and potential filter bubbles |
| Credit Card Fraud Detection | Financial security | Scores transactions against account behavior using rules and machine learning | Detects anomalies at high volume and in real time | Rare fraud cases complicate training, and false positives inconvenience customers |
| Deep Learning for Diabetic Retinopathy Screening | Medical imaging and eye care | Uses convolutional neural networks to identify disease patterns in retinal images | Supports consistent screening where specialists are scarce | Depends on image quality and population-specific validation |
| Deep Learning for ECG Arrhythmia Detection | Cardiology and wearable monitoring | Analyzes ECG time-series signals with convolutional neural networks | Can detect intermittent rhythm events during continuous monitoring | Signal quality and population differences can affect performance |
| Ecological Momentary Assessment and Mood Pattern Detection | Behavioral health and self-tracking | Collects repeated, in-the-moment reports with contextual information | Reduces recall bias and reveals situational patterns | Participant burden can cause missing data and affect behavior |
| N-of-1 Trials and Single-Person Analysis | Personalized health and self-experimentation | Compares outcomes across structured treatment and control periods for one person | Provides evidence tailored to individual responses | Carryover effects and unstable baselines can confound results |
From Spotted Patterns to Tested Conclusions
A mood dip that shows up every Thursday. A purchase that sits far from a cardholder's usual pattern. A run of low scores after late doses. Each of these is a hypothesis, and the eight examples above all earn their keep by making that distinction a working procedure.
Three rules carry across every one of them.
- Build a baseline before judging anything. Shewhart's limits, a cardholder's spending profile and a fraud model's features all come from a period treated as normal. A personal baseline needs the same thing: a stretch of consistent entries long enough to cover ordinary week-to-week variation. Recalculate it after a deliberate change in practice, because recalculating after every new reading just tracks noise.
- Treat flags as prompts for review. A point outside the control limit, a declined card, an irregular-rhythm alert and a detected mood dip are all requests for attention. Look at what moved, when it moved, and what else was happening before you assign a cause.
- Test suspected causes with structured on-off comparisons. The N-of-1 design exists because the alternative, living forward and reconstructing the story backward, is where expectancy does its best work. Alternate conditions in fixed blocks, define the outcome in advance, and accept that a few cycles settle very little.
The failure mode that catches the typical tracker is finding a pattern and stopping the inquiry there. A retroactive link between a dose and a good afternoon ignores sleep, stress and workload, and it survives precisely because nobody wrote the confounders down at the time.
A structured journal earns its place. MicroTrack provides a 10-point mood scale, flexible two-phase entries so you can log the dose in the moment and the reflection later, and trend visualizations across weeks and months. Its insights include frequency and time-of-day distributions and lightweight pattern detection in your own data, which keeps the descriptive findings separate from the causal claims you have not tested yet. The journal is free forever, entries are encrypted in transit and at rest, and CSV export is available at any time, so the analysis never belongs to anyone but you.
If you have been reading your own entries and guessing at what they mean, that guesswork can get a structure this week. Start logging in MicroTrack and hold off on judging a single trend until a baseline exists.