Weekly Trend Analysis: A Practical Guide for 2026

The most popular advice about a rising weekly chart is also the most dangerous: if the line is going up, keep doing what you're doing. A green arrow can reflect a useful pattern, but it can also capture expectancy, regression to the mean, a better weekday mix, or one unusually good entry. Weekly trend analysis is valuable precisely because it slows interpretation down. It turns scattered observations into a reviewable hypothesis, not a verdict.
For mood and microdosing logs, the practical question isn't “Did this week look better?” It's “What changed, how consistently did it change, and what should I do next without pretending the chart proves causation?” The method below treats every weekly pattern as a decision aid. You'll clean the entries, select an aggregation method, choose a visualization that matches your question, test signal against noise, and write an action that can be checked in the following week.
Table of Contents
- Why Most Weekly Trend Charts Mislead Trackers
- Preparing and Filtering Your Entries for a Clean Week
- Aggregating by Week and Smoothing the Noise
- Choosing the Right Visualization for the Question You Are Asking
- Detecting Meaningful Changes Without Fooling Yourself
- Interpreting a Real Six-Week Run Step by Step
- Turning Weekly Insights into Next-Week Action
Why Most Weekly Trend Charts Mislead Trackers
A weekly chart compresses messy human experience into a shape your brain can read instantly. That convenience creates a trap. An upward line feels like confirmation, especially when it follows a new routine, dose, or schedule. Yet the line doesn't know whether the improvement came from the intervention, anticipation, better sleep, a calmer workweek, or the natural return from an unusually difficult starting point.
A 2025 systematic review of 48 microdosing studies found that self-reported benefits were common, while placebo-controlled designs substantially reduced significant effects and produced more mixed results. The finding doesn't make a positive experience meaningless. It means perceived improvement can't confidently be assigned to pharmacological action alone (the systematic review of microdosing research).
Three distortions appear repeatedly in personal logs:
- Expectancy and placebo: You may report differently after believing a dose should help. That change is psychologically real, but it doesn't establish a dose effect.
- Regression to the mean: People often begin tracking during a difficult period. A later week may look better only because extreme observations tend to move closer to a person's usual range.
- Ordinary variation: Sleep disruption, stress, illness, exercise, deadlines, holidays, and weekday composition can move mood scores without any change in the underlying routine.
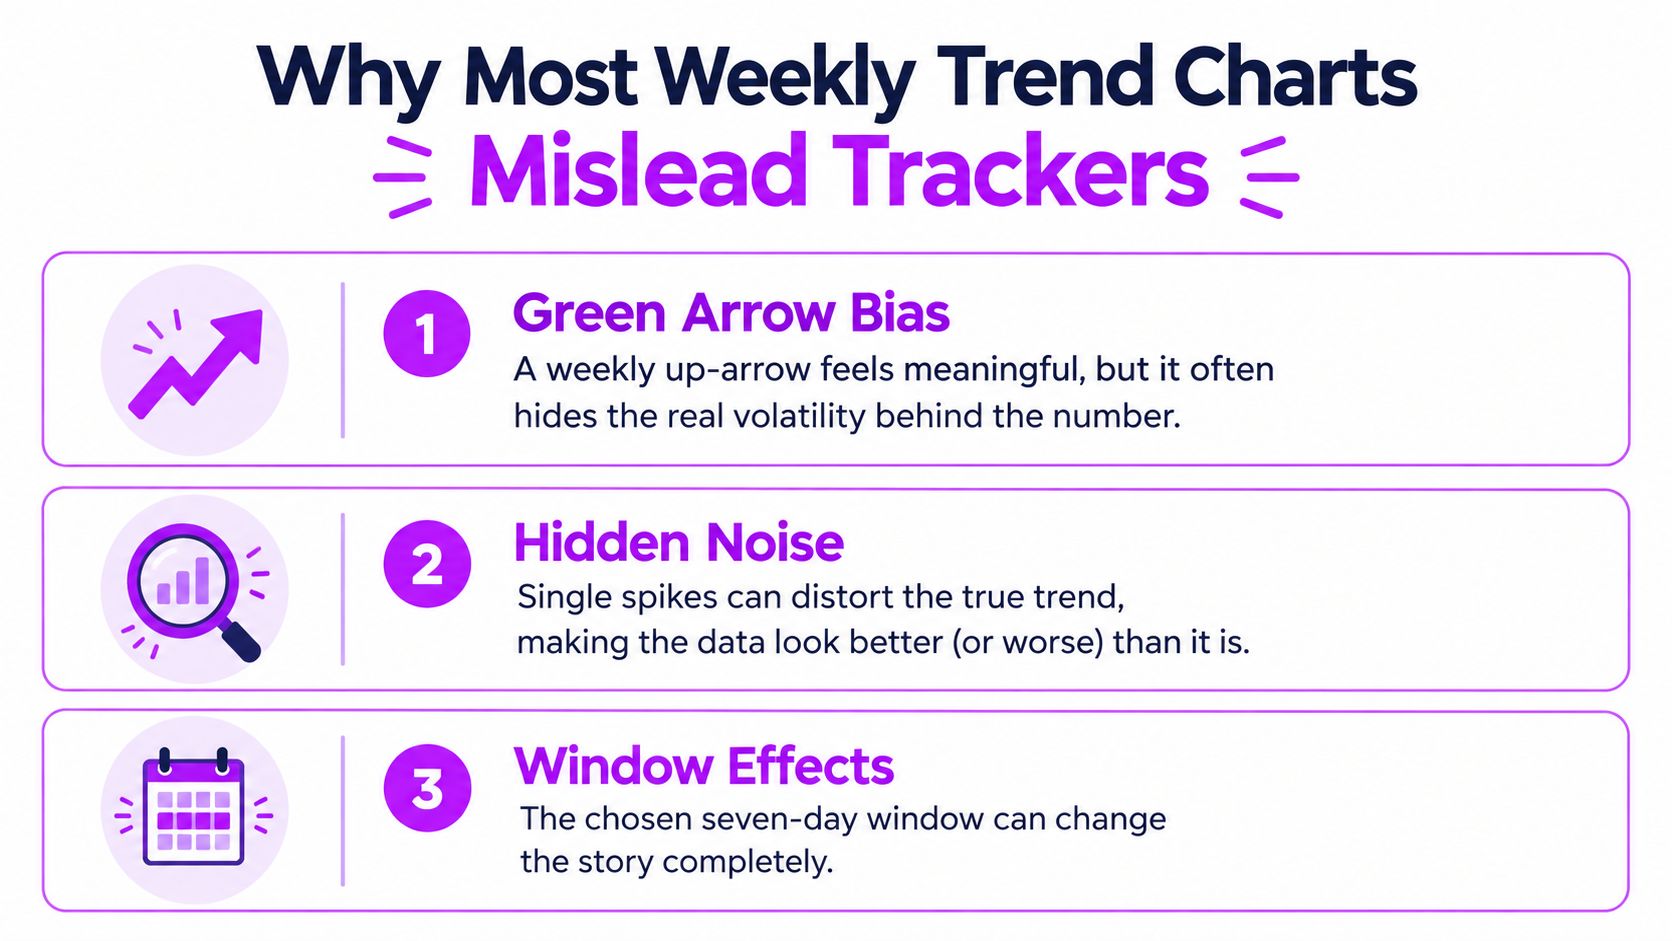
Working rule: A weekly trend is a hypothesis generator. It becomes more useful when you test it against comparable days, repeated weeks, confounders, and missing data.
A credible review therefore asks whether the apparent gain survives alternative explanations. Compare dose and non-dose days, check whether the same weekday repeatedly behaves differently, inspect raw entries before smoothing, and annotate major events. The aim isn't to eliminate uncertainty. It's to make your next decision proportionate to the evidence.
Preparing and Filtering Your Entries for a Clean Week
A clean week begins with a defined window. Pick a consistent seven-day boundary, such as Monday through Sunday, and keep that boundary visible in every summary. If you change the window halfway through a review, the chart may show a different mixture of weekdays rather than a meaningful change in your experience.
Next, preserve the structure of the schedule you followed. Filter by a planned protocol if that's the question, but record skipped days and added days as explicit overrides. A missed dose isn't the same as a missing log, and a non-dose day isn't the same as no observation. Those distinctions determine whether a weekly average describes your behavior or merely your available records.
Build a small, inspectable dataset
Suppose you use a 10-point mood scale, record a morning mood score, and add an evening reflection. A Monday entry might contain a morning score of 6, a dose marker, and an evening note about focus and sleep. A Tuesday entry might contain a morning score of 5, no dose, and a reflection that explains a stressful meeting. Keep both phases linked to the same date rather than replacing the morning score with the evening impression.
This two-phase approach preserves timing. You can ask whether mood changed during the day, whether the evening reflection adds context, and whether a dose-day observation differs from a non-dose observation. It also prevents a polished weekly average from hiding the fact that some scores came from mornings and others from evenings.
A practical preparation checklist:
- Keep raw values: Show each original score beside the weekly summary. Smoothing is an additional view, not a replacement dataset.
- Mark missingness: Display skipped entries, incomplete reflections, and days logged at a different time.
- Separate exposure categories: Label dosing days, non-dosing days, placebo or comparison periods when applicable, and washout gaps.
- Record weekday composition: A week with more workdays may not be comparable to a week containing holidays or unusual travel.
- Export a private copy: A tracker such as CSV data export for journal records lets you preserve the underlying entries for independent review.
Ecological momentary assessment research found high between-participant reliability for positive and negative mood items, with coefficients of at least 0.98, while within-participant reliability was moderate at 0.64 and 0.56. In plain language, a mood scale can distinguish people relatively well, but one person's own week-to-week changes contain more measurement noise (mood reliability in ecological momentary assessment).

That's why a complete but imperfect record is often more informative than a selective set of unusually good entries. If you only log when you feel excellent or terrible, the weekly average may describe your logging habit rather than your week.
Aggregating by Week and Smoothing the Noise
Once entries are clean, choose the summary that matches the decision. A simple week-over-week average answers, “How did this defined week compare with the previous defined week?” It's easy to understand, but a single unusual week can dominate the story.
A rolling mean answers a different question. A four-week rolling mean reduces the visual influence of one unusually high or low week and helps reveal persistent direction. It also introduces delay, so it's a poor choice when you need to understand what happened yesterday or decide whether a specific day felt different.
Weekday-aligned averages expose another source of confusion. If Monday scores are repeatedly lower and Friday scores higher, a weekly rise may reflect a change in the number or balance of those days. Aligning Monday with Monday and Friday with Friday can show whether the apparent improvement survives calendar composition.
Match the calculation to the question
Consider six weeks of mood entries under a Fadiman-style pattern, with one dosing day followed by two non-dosing days. The raw series may jump on individual dose days, flatten during a difficult work period, and recover during a quieter week. A week-over-week view preserves those changes. A four-week rolling view dampens the jumps and reveals whether the broader level is moving. A weekday-aligned view tests whether the schedule is being confused with the calendar.
Use the views together, but don't let the smoothest line become the official truth. Keep the numerator, the number of completed entries, dose status, and raw distribution visible beside every aggregate. A higher average based on fewer observations deserves more caution than a similar average supported by repeated entries across comparable days.
Weekly data also need calendar awareness. A calendar year doesn't contain an exact whole number of weeks, typically 52 but sometimes 53, and seasonal components can depend on observations 52 weeks earlier, 53 weeks earlier, and sometimes future observations when estimates are revised (weekly seasonal adjustment methods). For a personal tracker, that means year-to-year weekly comparisons should preserve date boundaries and calendar context rather than assuming every week occupies an interchangeable slot.
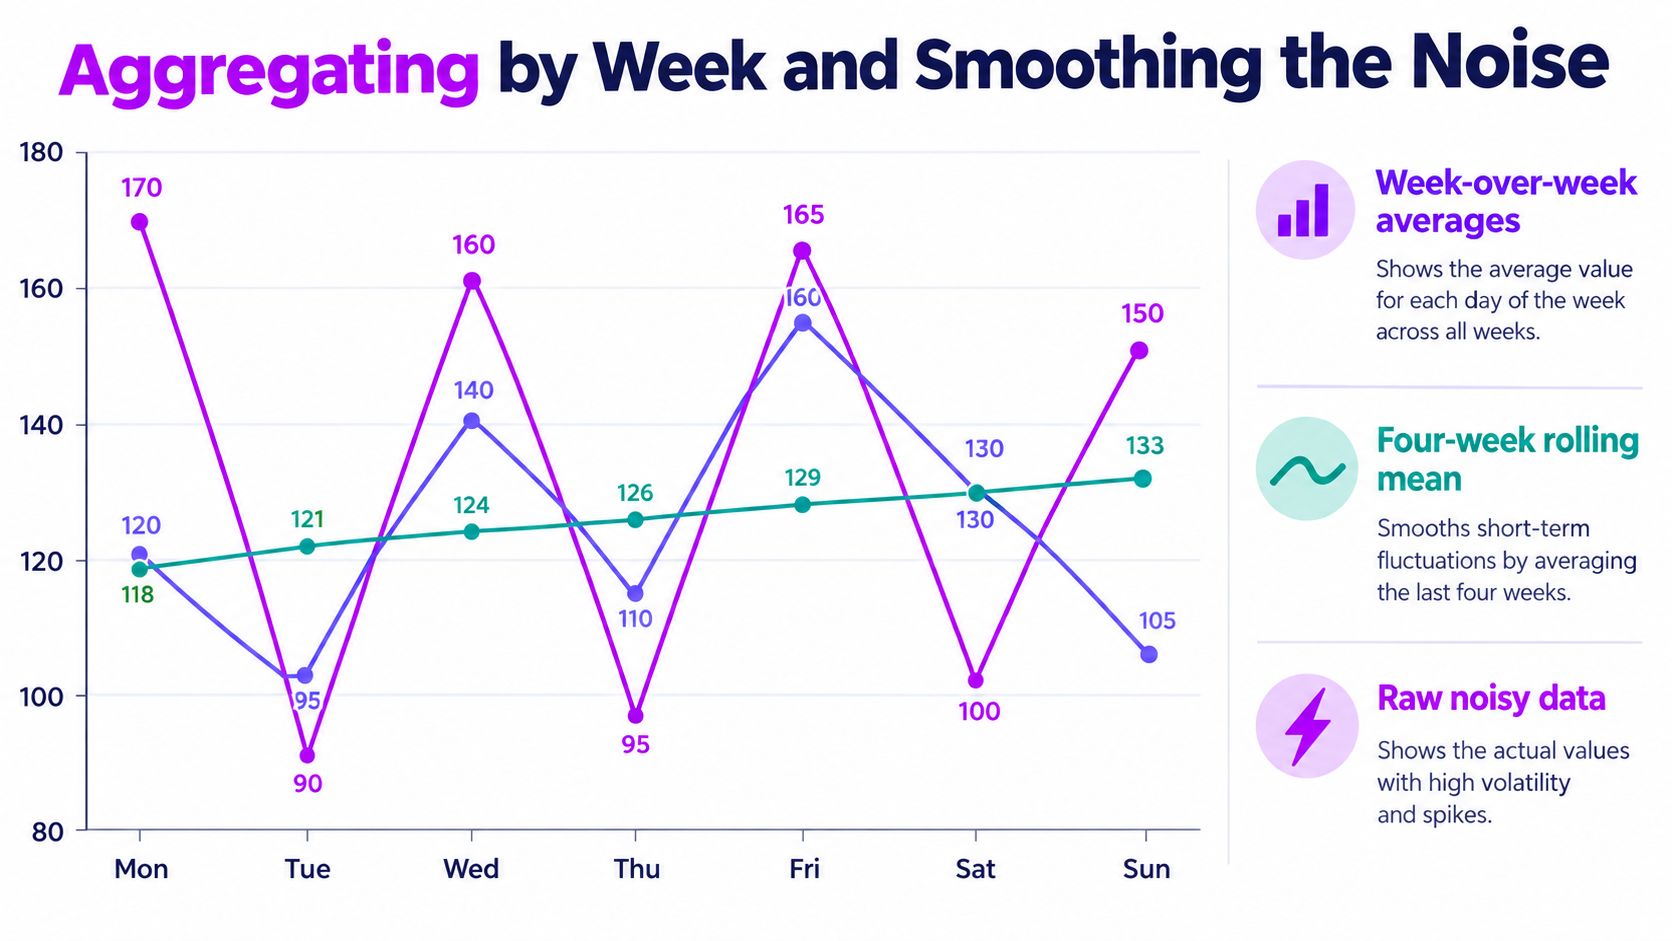
A short visual lesson on this topic can help you see why raw variability and smoothed direction answer different questions.
For a broader perspective across longer windows, long-term trend analysis can complement the weekly view. The weekly chart tells you what deserves attention. The longer view helps you decide whether the pattern has lasted long enough to influence a more durable conclusion.
Choosing the Right Visualization for the Question You Are Asking
The best chart is the one that answers the decision in front of you. A line chart is attractive because it shows direction quickly, but it can hide scattered observations behind a single connected path. A distribution plot can look less dramatic while revealing that a weekly average came from a wide mix of scores.
Schedule matters too. A qualitative study reported the Fadiman protocol, one dosing day followed by two non-dosing days, as the most common reported protocol among respondents who reported a schedule, at 38 percent. The same study reported 8 percent for five days on and two days off, 2 percent for four days on and three days off, 6.1 percent for alternate-day dosing, and 5.6 percent for daily dosing (reported microdosing schedules). These are reported practices, not evidence that one schedule works better than another.
| Question you want to answer | Best visualization | Schedule fit |
|---|---|---|
| Is the overall level moving over time? | Line chart with raw points | Useful for Fadiman, Stamets, and custom schedules |
| Are scores tightly grouped or widely scattered? | Distribution plot or strip plot | Useful for comparing dose and non-dose days |
| Does timing appear related to mood? | Time-of-day heat strip | Useful for any schedule with consistent timestamps |
| Did I follow the plan I intended? | Frequency bar | Especially useful for Fadiman and Stamets schedules |
| Which days differ from the personal baseline? | Annotated dot plot | Useful for custom calendars and schedule overrides |
For a Fadiman-style schedule, a frequency bar should compare planned dosing days with completed dosing days. For a Stamets-style schedule, the same view can expose whether a run of dosing days was interrupted. A custom calendar needs explicit skip and add markers, or the chart may misclassify a deliberate change as noncompliance.
A time-of-day heat strip is particularly useful when morning and evening entries coexist. It can show whether the apparent effect is tied to when you measure rather than when you dose. A strip plot can then show whether the pattern is repeated or driven by one isolated point.
Use data visualization best practices for tracker review to keep the raw observations, labels, and measurement context close to the summary. A visually impressive chart that removes those details may be easier to admire and harder to interpret.
Detecting Meaningful Changes Without Fooling Yourself
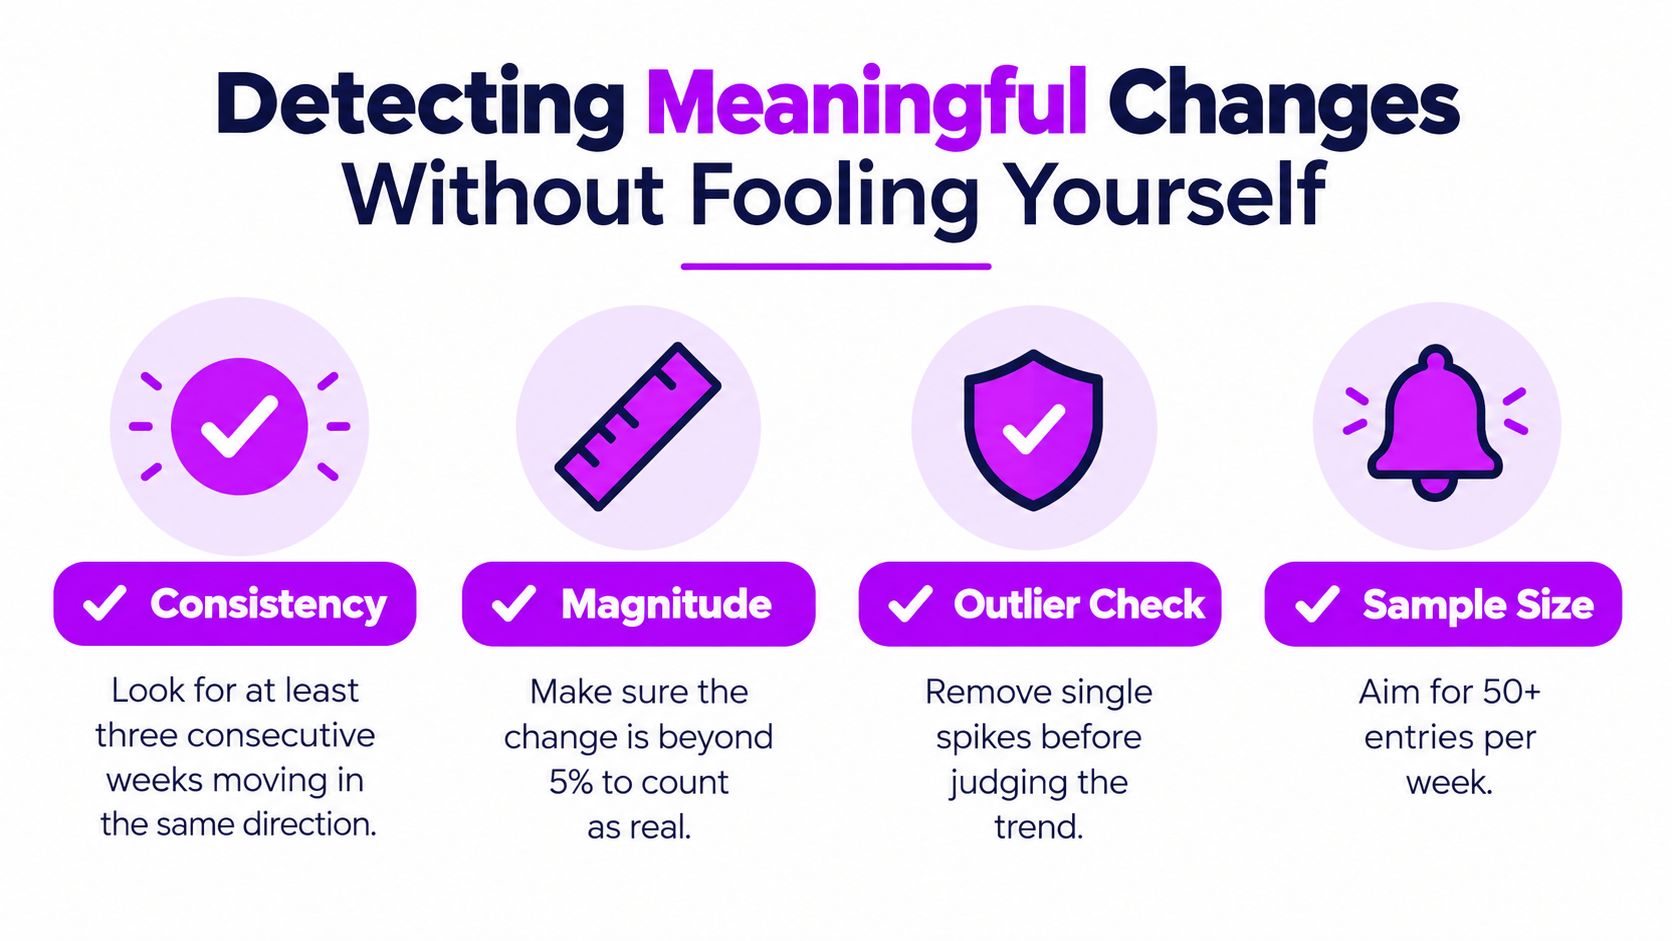
A higher weekly average isn't automatically a meaningful change. Start with within-week comparisons: examine dose days and non-dose days among observations collected under similar conditions. Then compare those results with the rolling personal baseline, not with an abstract ideal score.
A useful exploratory flag is a week that sits more than one personal standard deviation from the rolling baseline. Treat that flag as an invitation to investigate, not as a statistical declaration. Ask what else changed, whether the week had enough comparable entries, and whether the same pattern appears again.
Separate timing as well. Same-day effects, next-day effects, and changes that persist across several weeks are different claims. A 2024 rapid review of 19 placebo-controlled microdosing studies found mixed results. One randomized LSD study reported acute positive mood increases and reductions in negative mood on dosing days, but little evidence of persistent mood changes after six weeks. Another study found reduced depression and improved mood immediately after dosing and 48 hours later only among participants with relatively high baseline depressive symptoms (the rapid review of placebo-controlled studies).
Use a four-question signal check
- Does the pattern repeat? One strong week is an observation. Repeated separation across comparable weeks is more informative.
- Does it survive confounder review? Annotate sleep disruption, illness, stress, exercise changes, travel, deadlines, and major life events.
- Does timing make sense? Record whether the change appears on the same day, after a delay, or only in a smoothed long-term view.
- Does the result depend on one point? Remove nothing without review. Mark influential spikes and inspect the conclusion with and without them.
Interpretation rule: Call a pattern “promising,” “uncertain,” or “probably noise” before calling it effective.
That language protects the next decision from the chart's emotional pull. If a positive trend is psychologically meaningful, record that experience. If the data don't separate it from expectancy or ordinary variation, keep the causal claim modest.
Interpreting a Real Six-Week Run Step by Step
Consider a fictional tracker with six weeks of morning mood scores, evening reflections, dose markers, and sleep notes. Week one establishes a baseline. Week two shows a clear dose-day bump, but the non-dose days remain close to baseline. The appropriate conclusion is not “the routine works.” It's “same-day change is worth checking again under comparable conditions.”
Week three is mixed. The user sleeps better, logs consistently, and reports moderate scores across both dose and non-dose days. That weakens the case for a dose-specific explanation, but it strengthens confidence that the measurement process is becoming more stable. Week four is flat after a sleep disruption. The user should annotate the disruption and avoid adjusting the schedule in response to a week with an obvious confounder.
Week five shows a delayed improvement, with stronger non-dose-day reflections than in earlier weeks. That pattern deserves a delayed-effect label, not a definitive causal label. Week six is noisy because of a major life event. The user should preserve the data, flag the event, and avoid letting one extreme week reset the baseline.
A useful weekly note might read:
- Observation: Dose-day scores rose in week two, while week five improved more broadly.
- Context: Sleep disruption affected week four; a major event affected week six.
- Confidence: Same-day signal is plausible but unconfirmed; delayed pattern is uncertain.
- Next action: Keep the measurement time consistent, continue annotating confounders, and compare another set of comparable weeks.
A double-blind, placebo-controlled psilocybin study used a within-subject design with two measurement weeks separated by a washout week. One week involved 0.5 grams of ground, homogenized dried mushrooms, while the comparison week used an equal-weight edible-mushroom placebo (the within-subject placebo-controlled study). The analytical lesson is practical: mark dose, placebo or non-dose periods, and washout gaps separately. A tracker can't recreate that design casually, but it can avoid blending unlike periods into one misleading average.
Turning Weekly Insights into Next-Week Action
End every week with a short review, not an extended stare at the chart.
- Check the schedule: Compare planned and completed dosing days, including skips and additions.
- Inspect the raw entries: Look for missing days, changed logging times, and single-point spikes.
- Annotate context: Record sleep, illness, stress, exercise, travel, and major events.
- Compare categories: Review dose days, non-dose days, and delayed observations separately.
- Choose one action: Hold the routine, adjust the measurement process, or pause interpretation until the dataset is cleaner.
- Preserve the record: Export or back up the week if the pattern may be useful for personal review, coaching, or a therapist conversation.
Privacy belongs in this workflow because it affects data quality. A 2025 review of 17 major wearable manufacturers found that many policies didn't clearly explain data sharing with governments or third parties, breach notification, or the reasons information was shared (the review of wearable privacy policies). If people fear exposure, they may log selectively or avoid sensitive details. That changes the measurements themselves.
Be cautious when a chart has many missing days, inconsistent scales, shifting measurement times, unmarked schedule changes, or a conclusion based on one unusually strong week. A trustworthy weekly trend analysis preserves uncertainty and still produces a concrete next step.
MicroTrack gives you a structured place to record mood on a 10-point scale, use two-phase entries, mark dose and non-dose days, follow a flexible schedule, and review weekly trend visualizations without hiding the underlying logs. Visit MicroTrack to build your next seven-day review, export the data when a pattern matters, and turn the chart into a measured decision.