How to Trace a Pattern in Your Microdosing Journal

You've logged five days with mood at 7 out of 10 after starting a dose, and it feels like a clear result. Then a rough week arrives, and the story that the dose works starts to wobble. The useful question isn't whether the journal contains a good run. It's whether the same change repeats when you account for timing, ordinary variation, and what else was happening.
Table of Contents
- What Counts as a Pattern in Your Microdosing Journal
- Log the Fields That Make a Pattern Visible
- How to Tag and Filter Entries Into Comparable Groups
- Spot Patterns in Charts Before Running Any Numbers
- Simple Statistics That Separate Signal From Noise
- Test Carryover and Lag Before Trusting an Effect
- Fix Misleading Patterns and Decide What to Trust
What Counts as a Pattern in Your Microdosing Journal
A pattern is a dated signal that repeats and survives a second look. One good day can be luck; a streak can reflect a temporary change in sleep, stress, or routine. A pattern earns more confidence when it appears in comparable periods and doesn't disappear after you check the surrounding context.
Use this six-step route:
- Define one outcome and the fields you'll record.
- Tag entries and filter them into comparable groups.
- Inspect the timeline visually.
- Calculate simple statistics and compare the gap with a threshold you set in advance.
- Test lag and carryover from earlier doses.
- Decide whether the pattern is ready to guide your next observation.
Each step narrows the search; it doesn't require you to keep adding more data fields. A favorable run may come from a bad baseline, a delayed effect from a prior dose, or a weekday routine. The point is to test those alternatives before treating a chart as evidence.
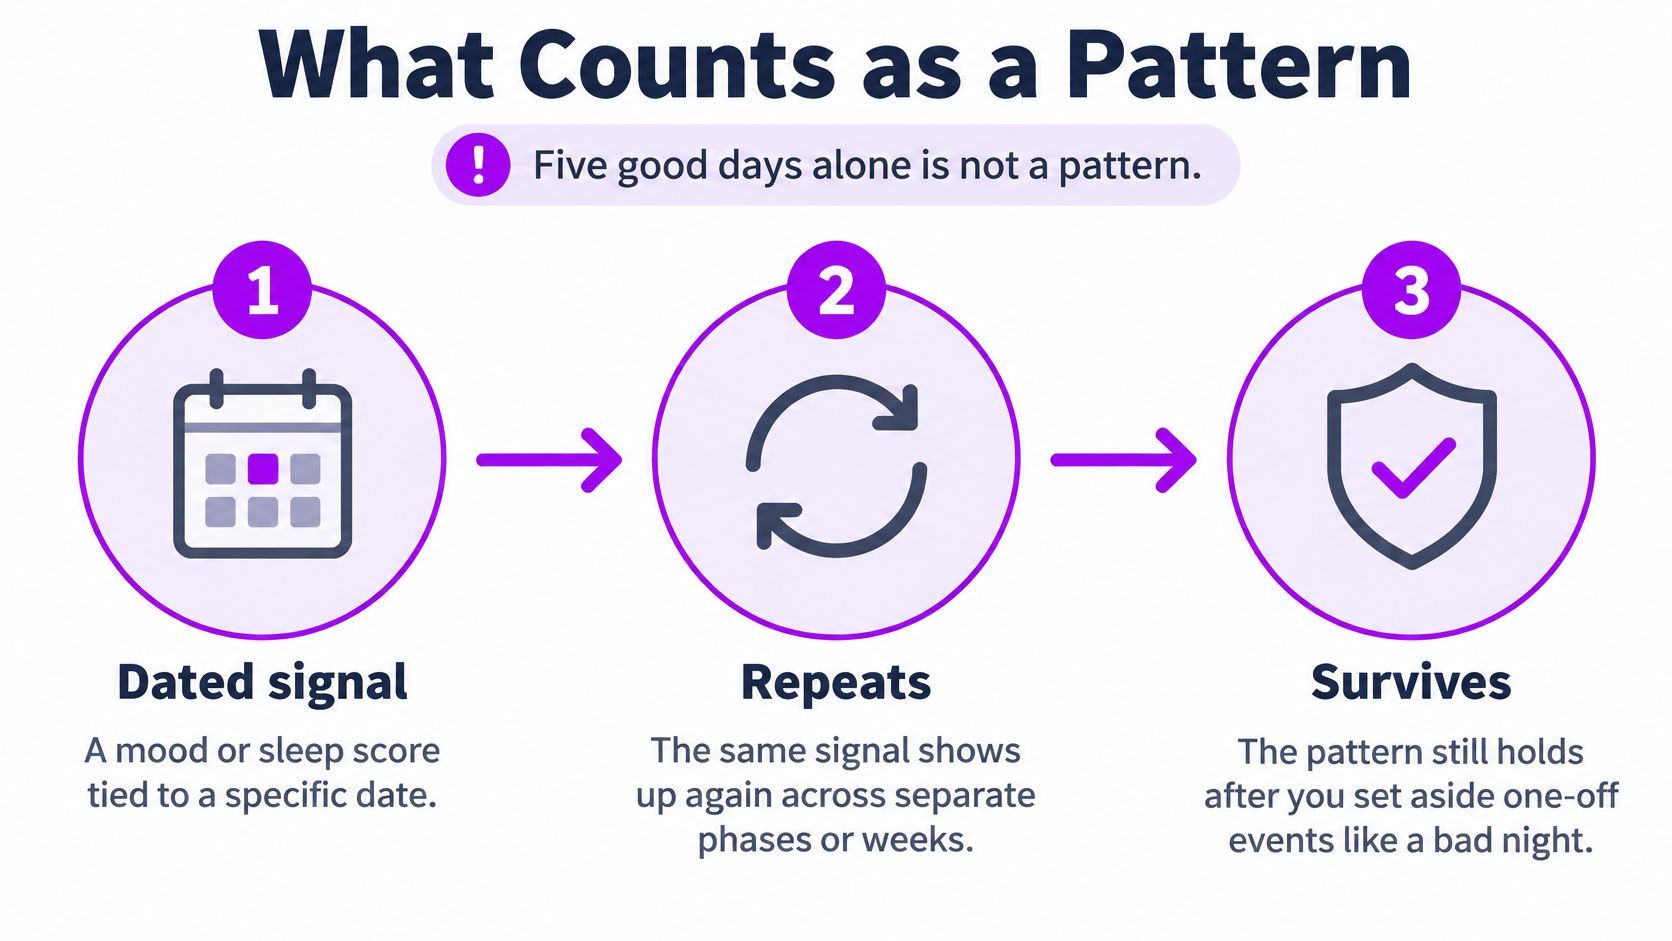
You'll finish with a short written verdict for each candidate pattern: what repeats, how often, how large the change is, and how confident you are. The same workflow works in any spreadsheet built from a journal export. Its basic logic resembles a control chart: establish a baseline and look for sustained signals rather than reacting to every fluctuation, a distinction described in the NIST statistical handbook's process-monitoring chapter.
Log the Fields That Make a Pattern Visible
Start with a compact table. One outcome gives you a clear comparison; the other fields help you spot conditions that could shift mood independently of a dose.
| Field | Format | Example entry | Why it matters |
|---|---|---|---|
| Mood score | 0–10, same time daily | 7 | Primary outcome; keep the scale fixed |
| Dose taken | Yes or skip, plus amount in your unit | Yes, amount in your unit | Defines the exposure you compare |
| Dose time | Clock time | 08:30 | Separates same-day from next-day effects |
| Phase | On, off, or custom label | Off, week 3 | Lets you compare blocks |
| Sleep | Hours, previous night | 7.5 hours | Common confounder of mood |
| Caffeine | Cups, before or after noon | 3 cups, before noon | Common confounder of mood |
| Stress | 1–5 scale | 4 | Common confounder of mood |
| Exercise | Minutes | 30 min | Shifts mood independently of any dose |
Pick one primary outcome, such as a daily mood score on a fixed 0–10 scale recorded at the same time. Don't change what “7” means halfway through the log. Record dose timing as well as whether you took one: morning and evening entries don't represent the same exposure window.
Include sleep, caffeine, stress, exercise, alcohol, and travel as context if you can track them consistently. These factors can move mood on their own, so they help you distinguish an apparent dose association from a change in daily life. A time-series approach that records exposure timing and time-varying confounders also helps prevent you from treating related daily entries as independent evidence, as explained in this clinical methods article on analyzing repeated self-tracking data.
Keep the system usable on a bad day. A short, complete log is more informative than a detailed form with many blanks. Enter the dose and mood score in the moment, then add reflections later; keep tag wording consistent. Leave a missing value blank rather than entering zero, and mark a planned off day as a skip rather than letting it look like a missing entry. A two-phase entry process can help separate quick daily recording from later reflections; MicroTrack's structured data entry guide describes that approach.
How to Tag and Filter Entries Into Comparable Groups
Raw entries aren't comparable just because they're in the same journal. A dose phase, a poor night's sleep, and a stressful week can all appear beside the same mood score. Build groups that let you check one plausible explanation at a time.
Make a short tag list. Start with five to eight tags, such as
poor-sleep,high-stress,travel,alcohol, andnew-batch. A small vocabulary keeps each group large enough to inspect.Tag when you log. Add
poor-sleepthat morning, not weeks later when you're trying to remember why the day felt different. Retrospective tags can slowly replace the day's details with your later interpretation.
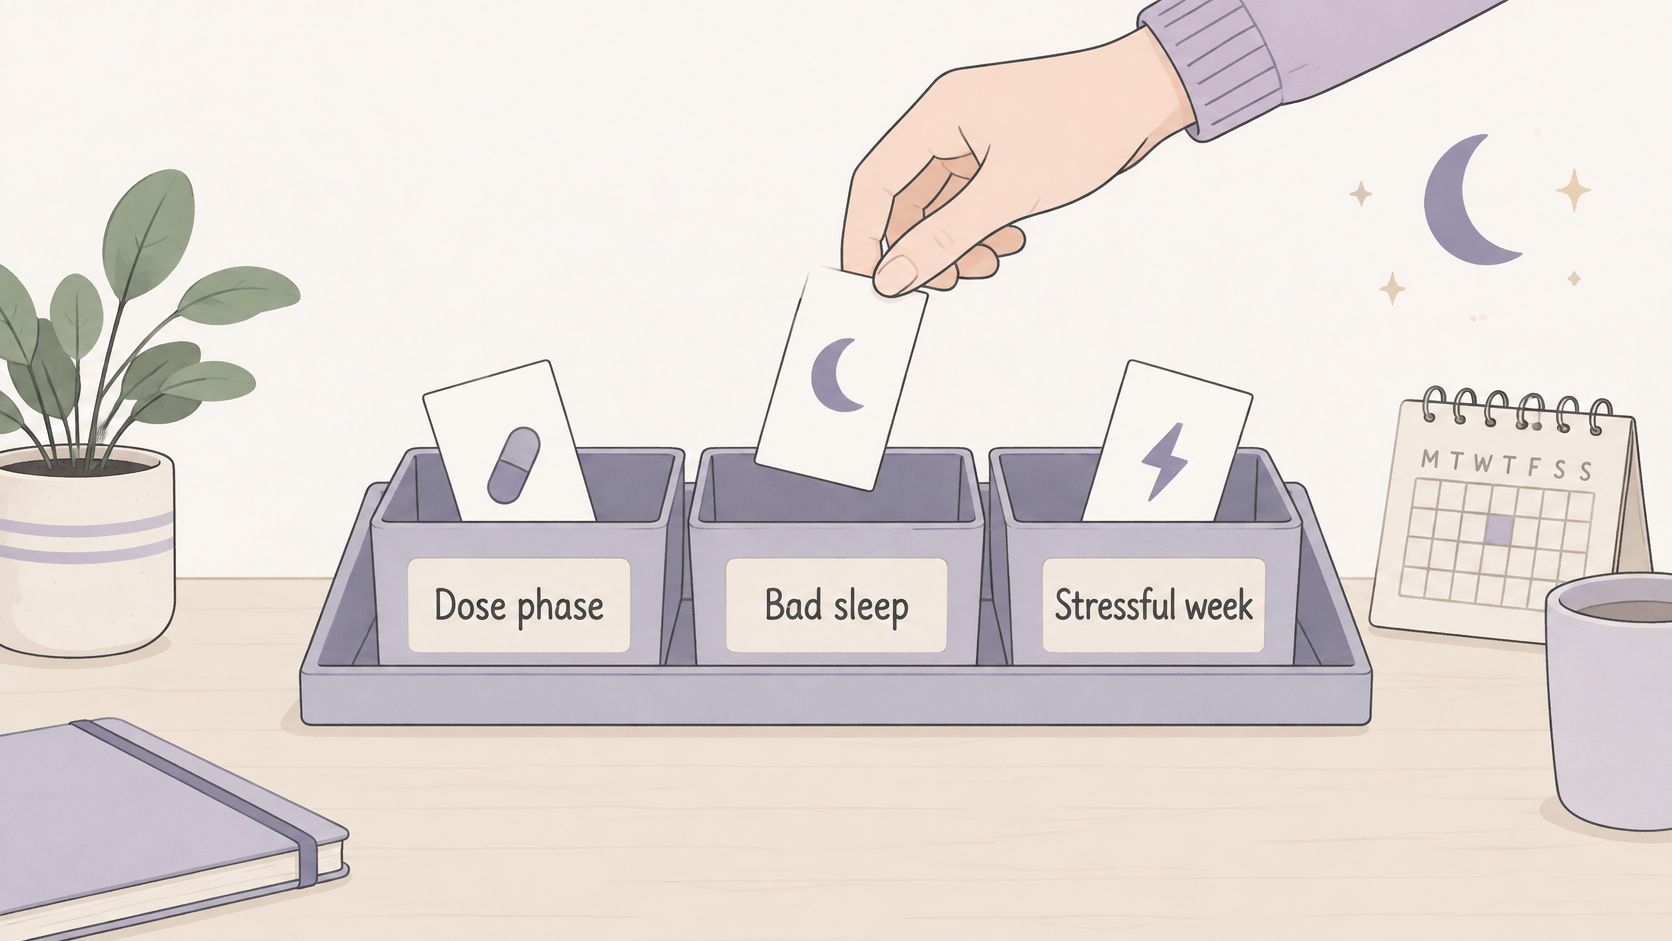
Filter by phase first. Compare on-days with off-days, or compare the specific blocks in your schedule. That gives you a starting view of whether the outcome differs across exposure conditions.
Add one confounder filter at a time. Check the phase gap among
poor-sleepentries, then remove that filter and checkhigh-stressentries. If you change several filters together, you won't know which condition changed the comparison.Count before reading averages. Write down the number of entries and date range in each group first. A group with only a few days can suggest a question, but it shouldn't carry the weight of a reliable result.
Protect the raw data. Export the journal to CSV, preserve the original sheet, and do your filtering on a copy. This lets you undo a mistaken tag or formula without changing the record you're trying to understand.
Save named views tied to questions. Use names such as “on vs off, all days” and “on vs off, excluding poor sleep.” Each view should make clear what you're testing.
Watch for tag sprawl. Once similar tags split the same kind of day into tiny groups, merge them into a broader label, such as combining “late night” and “short sleep” under poor-sleep. At the end, you should have named groups, each with a count and date range, ready for visual comparison.
Spot Patterns in Charts Before Running Any Numbers
A chart can quickly reveal runs, shifts, and timing problems, but it can't prove cause. Plot daily mood as a line, shade the on- and off-phases in the background, and overlay a 7-day rolling mean. Set the center line from the off-phase baseline, not from the entire log, so a possible phase shift doesn't pull the reference toward itself.
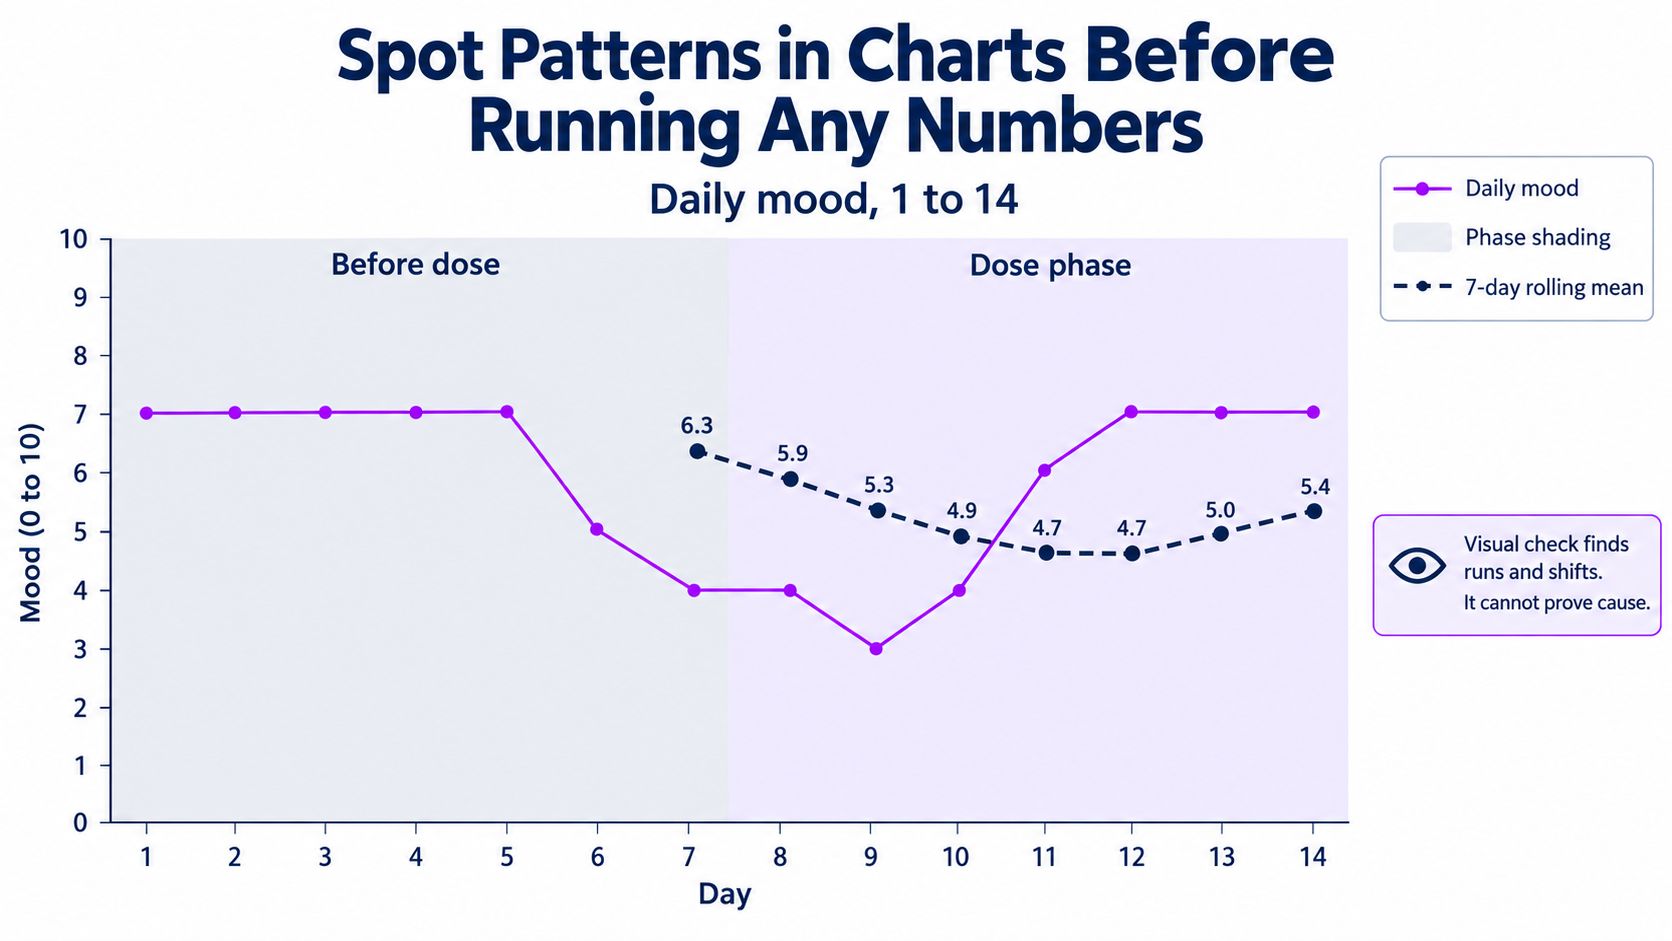
Look for a sustained run
Check whether consecutive observations stay on one side of the baseline center line. Eight consecutive points on one side is a useful signal to investigate, not proof that a dose caused a change. A separate control-chart signal is two of three consecutive points beyond a two-standard-deviation limit; treat that as a stronger departure worth checking against the dates and context.
Check for a weekly rhythm
A good-looking phase average can conceal a weekday pattern. Make a heatmap with weekday on one axis and mood on the other, then check whether Mondays, Sundays, or another day repeatedly sits lower. If dose times vary, also inspect a time-of-day distribution so morning and evening exposure aren't blended into one comparison.
Mark the first point and its context
A single spike at the edge of a phase is often a one-day event rather than a sustained shift. Beside each chart, write down the change you noticed, when it began, and the confounder you haven't ruled out. A progress visualization guide can help you choose views that make repeated changes easier to inspect.
Simple Statistics That Separate Signal From Noise
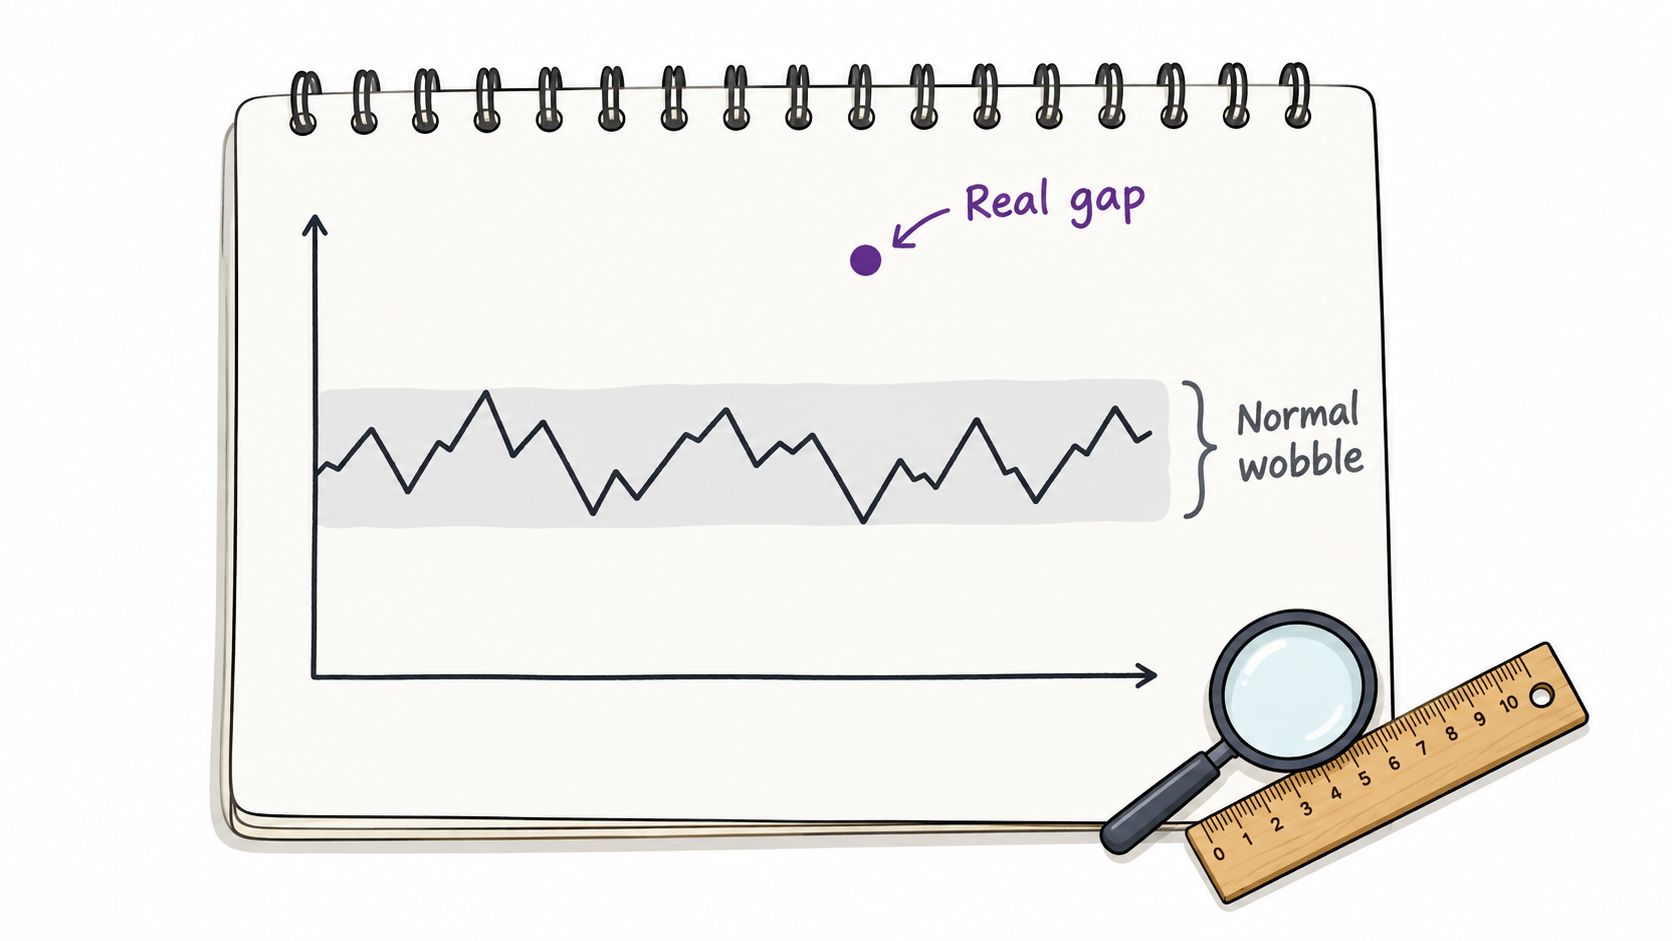
The key question is simple: is the gap bigger than the normal wobble? Each statistic below answers part of that question, and each has a failure mode worth knowing before you trust it.
| Statistic | What it tells you | Use it when | Watch out for |
|---|---|---|---|
| Phase mean difference | Average mood on-phase minus off-phase | Comparing two blocks | Ignores order and trend |
| Standard deviation per phase | Day-to-day spread | Judging whether a gap is large | Unstable with fewer than about two weeks |
| Rolling 7-day mean | Smoothed trend | Spotting weekly cycles | Hides single-day spikes |
| Lag-1 autocorrelation | Whether today resembles yesterday | Checking if entries are independent | High values shrink your effective sample |
| Lag-7 autocorrelation | Whether this week resembles last week | Testing a weekly rhythm | Needs several weeks of data |
| Minimum meaningful change | A gap you set in advance, such as 1 point | Deciding if an effect counts | Set it before reading the data |
Start with the two means. Calculate each phase's mean and standard deviation, subtract the off-phase mean from the on-phase mean, then compare that difference with a minimum meaningful change you decided on before looking at results. You might decide that a full point on a 10-point mood scale would matter to you. If the observed gap falls short of that threshold, stop rather than explaining away the shortfall.
A gap that clears the bar still has to survive the dependence check.
Autocorrelation asks whether today's mood resembles yesterday's, a value several days earlier, or the same weekday in the prior week. It helps show whether a suspected cycle holds across the full sequence rather than only in a memorable stretch of days. It also warns you when consecutive entries are too similar to count as independent observations.
Suppose off-phase mood averages 5.6 over 21 days and on-phase mood averages 6.8 over 21 days. The gap is 1.2 points, so it clears a 1-point threshold set in advance. The naive read stops there and calls the phase a win. Now add the dependence check: if lag-1 autocorrelation within the on-phase is 0.6, the rough effective sample size is (n(1-r)/(1+r)), or (21 \times 0.4 / 1.6), which comes to about 5 independent days, not 21. A gap built on five effective observations is weaker than the same gap built on twenty-one, so label the result exploratory and treat it as a lead, not a conclusion.
For a spreadsheet, AVERAGEIFS, STDEV.S, and CORREL on offset columns can calculate these summaries. A basic test that assumes every daily entry is independent will overstate certainty when adjacent moods move together, which is exactly what a journal produces.
Test Carryover and Lag Before Trusting an Effect
A good mood score on an off-day may reflect a prior dose rather than the off-phase itself. The logged day isn't always the day an effect begins or ends, so specify the windows you'll compare before reviewing the pattern.
- Separate three windows: compare same-day, next-day, and two-day outcomes after exposure. Mark observations near a phase transition separately from observations in a stable part of the phase.
- Plan a washout when appropriate: a washout interval gives a prior effect time to diminish before the next comparison block. Record what happens after exposure ends rather than assuming the effect stops on the last dose day.
- If washout isn't feasible, test the boundary: repeat the comparison with the first two days after each transition excluded. If the gap changes substantially, the transition may be driving the apparent effect.
- Vary phase order: alternate on- and off-blocks in a randomized or counterbalanced order instead of always starting with the same phase. Avoid back-to-back dosing when you're trying to separate exposure from lag.
A Fadiman 1-on/2-off or Stamets 4-on/3-off schedule gives you off-blocks to compare; a custom schedule can also alternate phases. The key is to keep the comparison interpretable, not to treat a named schedule as proof of an effect.
A UK guidance review of N-of-1 studies found that fewer than 20% reported a power analysis, and many methods did not adequately address carryover, within-person correlation, or period effects. That's a reason to keep conclusions modest: a few cycles rarely establish much on their own. A distributed-lag model with autoregressive errors can estimate immediate and carryover effects; without that modeling, use matched blocks and label the result exploratory, following the UK guidance on N-of-1 comparative studies.
Fix Misleading Patterns and Decide What to Trust
| Symptom | Likely cause | Fix |
|---|---|---|
| Pattern vanishes after two weeks | Short baseline or regression toward the mean | Extend the baseline and compare full cycles |
| Good run starts right after a bad week | Baseline effect, not the dose | Compare against a matched stable period |
| Mood dips every Monday | Weekday or work routine | Add a weekday filter and recheck the gap |
| Off-phase days look better than on-phase | Carryover or expectation | Add a washout and drop the first two days after transitions |
| Entries missing on bad days | Reporting gaps | Mark skips and count them, don't drop them |
| Correlation with mood disappears after sleep filter | Sleep explains the gap | Treat sleep as a covariate, not a dose effect |
Use a clear decision test before calling a result a working pattern:
- It repeats across at least three comparable cycles.
- The gap is meaningful according to the threshold you set before inspecting the data.
- It survives checks for lag, weekday, and sleep.
- The chart supports it, rather than the finding appearing only in an average.
If all four conditions hold, write the pattern down as a working hypothesis and test it in the next cycle. If any one fails, keep it as a question to investigate, not a finding. When you report it, note the phase dates, group counts, mood difference, relevant filters, and what remains uncertain. Don't confuse a repeated association with proof that one factor caused another; this guide to correlation versus causation gives that distinction a closer look.
This process is for self-observation, not medical advice. If you're managing anxiety, depression, or PTSD, or you take prescribed medication, bring your notes to a clinician. Don't stop or change a prescribed medication based on a journal chart.
To keep the next comparison clean, export your CSV or use a tracker's calendar overrides and trend views to mark planned skips and phase changes. MicroTrack offers two-phase entries, calendar overrides, trend visualizations, and CSV export for reviewing a journal over time.
Build a cleaner record for your next cycle with MicroTrack, where you can log dose details first, add reflections later, and review mood trends against your schedule. Start with one outcome, keep your comparison groups clear, and let the next cycle test whether the pattern holds.