Symptom Tracker App Guide: What to Log and Why
You're three days from an appointment and trying to answer the question your clinician will almost certainly ask: has this got better or worse since we last spoke. You remember a rough patch in early spring, a few good weeks after that, and a bad stretch you can't date. What you have is an impression, not a record.
A symptom tracker app exists to close that gap. It turns the vague sense that something shifted into dated entries on a fixed scale, which is the difference between saying "worse, I think" and showing that your headaches moved from a 4 to a 7 over six weeks while your sleep dropped from seven hours to five.
What follows walks through what a tracker records, which features decide whether the log is usable at all, how gaps and scales distort what you see, and how to compress a folder of entries into one page a clinician can read in ten minutes. It's also candid about where tracking stops helping and starts feeding anxiety.
Table of Contents
- What a Symptom Tracker App Records
- Features to Compare in a Symptom Tracker App
- Privacy Checks Before You Record Sensitive Symptoms
- How to Log Symptoms in Under a Minute
- Why Gaps and Missed Days Distort Your Trends
- What PHQ-9 Scores Mean When You Use One
- Turning Your Log Into a Clinician Summary
- Confirm the Tracker Fits Before You Commit
What a Symptom Tracker App Records
Every entry in a symptom tracker app holds the same small set of parts, whether the app spreads them across five screens or collects them in a single tap:
- The symptom. A name saved to your own list rather than free text you retype each time. "Left temple ache" is more useful three months from now than "head thing".
- Timing. When the symptom started, how long it lasted, and when you recorded it. Those are three separate facts, and a good app stores all three.
- A severity rating on a fixed scale. Usually 0 to 10, with 0 as none and 10 as the worst you can imagine. The number means nothing if the scale shifts underneath it.
- Context. Hours slept, medication or dose taken, meals, weather, stress, cycle day. Context lets you test an explanation instead of only describing a day.
Say you get recurring headaches. You're fairly sure they've worsened since spring, but March was stressful, April was busy, and by June the two had merged into one long bad mood. Forty dated entries on one scale settle the question in a way that forty memories can't.
A single thermometer reading tells you it's cold outside. A year of readings taken at the same time each morning tells you what winter does in your city. A trend is the same idea: many entries on the same scale, read in order.
Structured fields are what make that work at scale. An analysis of anonymized reports from a pregnancy symptom tracker covered 183,732 users who recorded 1,549,186 symptoms, with an average of just 17.18 days between a person's first and last report. Two lessons follow. Consistent fields are what made those observations comparable, and plenty of people track for weeks rather than months, so your first month is often the most valuable stretch you'll get.
Keep one distinction clear. Your entries are the evidence. The average, the line on the chart, the "your symptoms are improving" banner, all of that is the app's interpretation of your evidence, and it's only as trustworthy as what sits underneath.
Start here: before you open any app, write your top three symptoms on paper and the scale you'll use for each. Ten minutes now saves you from a month of numbers you can't compare.
Features to Compare in a Symptom Tracker App
Marketing pages list everything. Seven features decide whether your record survives a clinic visit.
| Feature | What it does | What to verify |
|---|---|---|
| Custom symptom list | Tracks the symptoms you actually feel instead of a fixed menu | Can you add, rename and archive symptoms? |
| Severity scale | Records intensity on one consistent scale | Does the scale stay the same on every entry? |
| Timestamps | Records when a symptom started and when it was logged | Are both times stored, and can you edit them? |
| Context fields | Links symptoms to sleep, medication, meals or stress | Can you add your own tags as well as preset ones? |
| Searchable history | Finds past entries by symptom, tag or date | Can you filter by symptom and date range? |
| Trend charts | Shows frequency and severity over weeks and months | Does each point show how many entries it is based on? |
| Reminders | Prompts you to log at a set time | Can you turn reminders off completely? |
Custom symptom lists decide whether the log describes your condition or the app's assumptions. A menu built for a different illness pushes you toward the nearest available option, and "fatigue" logged in place of "crash after a short walk" loses the detail that matters most.
Scale consistency is why a chart can be trusted at all. If an update swaps a 0 to 3 slider for a 0 to 10 slider, the line on your graph starts measuring the app's design history instead of your body.
Timestamps do more work than people expect. A morning symptom recorded at 11pm can be off by hours, so check that both the start time and the logging time are stored and editable.
Context fields turn description into explanation. Preset tags cover sleep, medication and stress; custom tags let you test a personal hunch, such as whether a particular meal or a dose day lines up with your worst afternoons.
Searchable history is the feature you'll use in the exam room. Being able to pull every entry for one symptom across a year is the difference between answering a question and guessing. Our journal history is searchable and filterable, which is the minimum bar we'd hold any tracker to.
Trend charts mislead in one specific way. A smooth line drawn from three entries looks identical to one drawn from thirty unless the chart shows the count behind each point. Reminders matter less than their marketing suggests. A prompt helps in week one and irritates by week six, so confirm you can switch it off completely rather than choose a quieter setting.
The check that settles most comparisons
If you test only one thing before committing, test the filter. Search a single symptom across the last six months and see what comes back: dates, severity, context tags, and the ability to narrow to a range. An app that can't do that will still hold your data, but you'll be reciting it from memory anyway.
Practical rule: a tracker that can't filter by symptom and date range is a diary with extra steps. Skip it.
Privacy Checks Before You Record Sensitive Symptoms
Privacy is a set of questions you answer before you type, not after. Once a mental-health entry, a reproductive-health note or a dose log sits inside an app, you can't take it back, and the policy you skimmed at signup becomes the terms you live with.
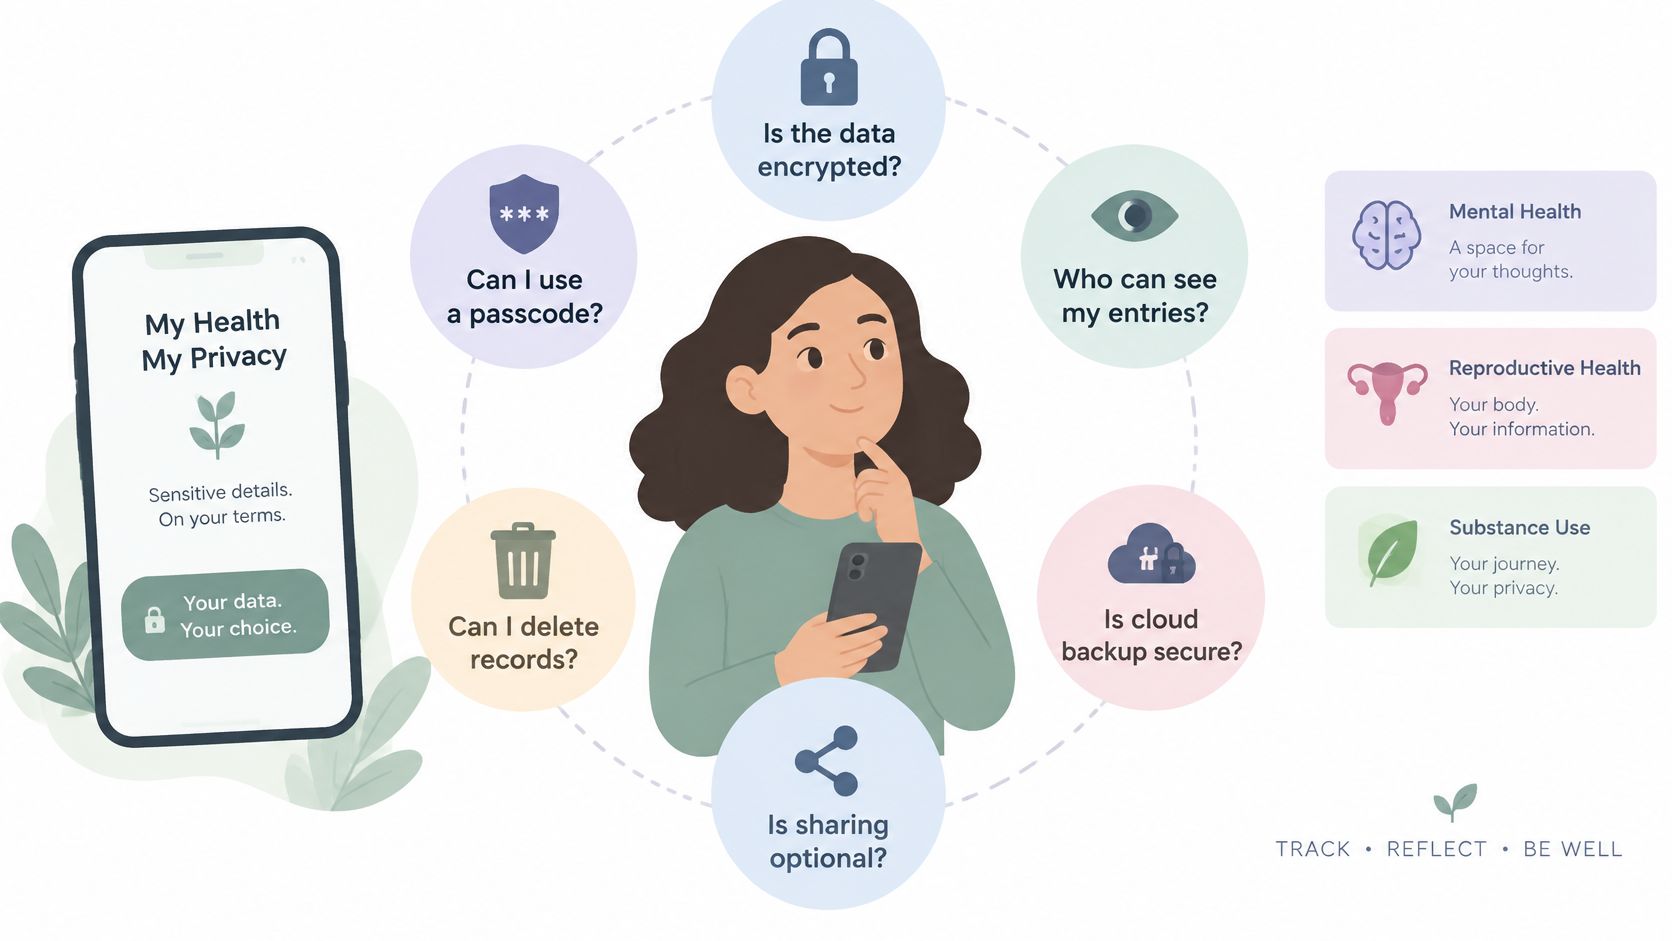
Work through six checks and write down the answers:
- Encryption in transit and at rest. Transit covers the trip from your phone to the server; rest covers the copy in the database. Ask for both, because either one alone leaves an obvious hole.
- Sale or sharing with third parties, including advertisers. Look for an explicit statement that your entries aren't sold or shared, not a promise to "respect your privacy".
- Use for AI model training. A journal becomes training material unless someone says otherwise. Check the wording on model improvement and whether you can opt out.
- Export in a standard format. You should be able to take every entry with you as a file you can open elsewhere, not a screenshot. Export is also your insurance if the app shuts down.
- Permanent deletion in one step. Deletion should remove the entries, not hide them from your view. If the language says "deactivate", assume the data stays.
- Ownership of the content. The clearest policies state that you keep the rights to what you write. Vague ownership language usually precedes a licensing clause.
The distance between what policies promise and what they permit is documented. A 2025 evaluation of health apps published in JMIR Human Factors found that privacy policies sometimes conflicted with app-store descriptions, that consent was often implicit through use, and that some policies permitted disclosure of health data to third parties. In that evaluation, only 4 of 10 symptom-checker apps carried the legally required provider imprint.
The legal floor is lower than commonly assumed. In the United States, HIPAA generally covers identifiable health information held by health plans, providers and clearinghouses, not the consumer app you downloaded yourself, as the FTC's mobile health app guidance explains. The FTC's Health Breach Notification Rule does apply to most health apps outside HIPAA and can require the company to notify consumers, the FTC and sometimes the media after certain breaches.
Privacy and clinical value are separate scores. A very private app may offer no interpretation at all, while an app that shares entries with your care team can be more useful clinically and needs clearer consent. On our side, MicroTrack doesn't sell, share or train AI models on your journals, and you keep ownership of everything you write, including notes, mood ratings and images; our guide to data security and privacy sets out the specifics.
How to Log Symptoms in Under a Minute
Long entries fail. The routine that survives a bad week is short enough to finish while the kettle boils, and it follows the same sequence every time.
Here's the flow, from opening the app to closing it:
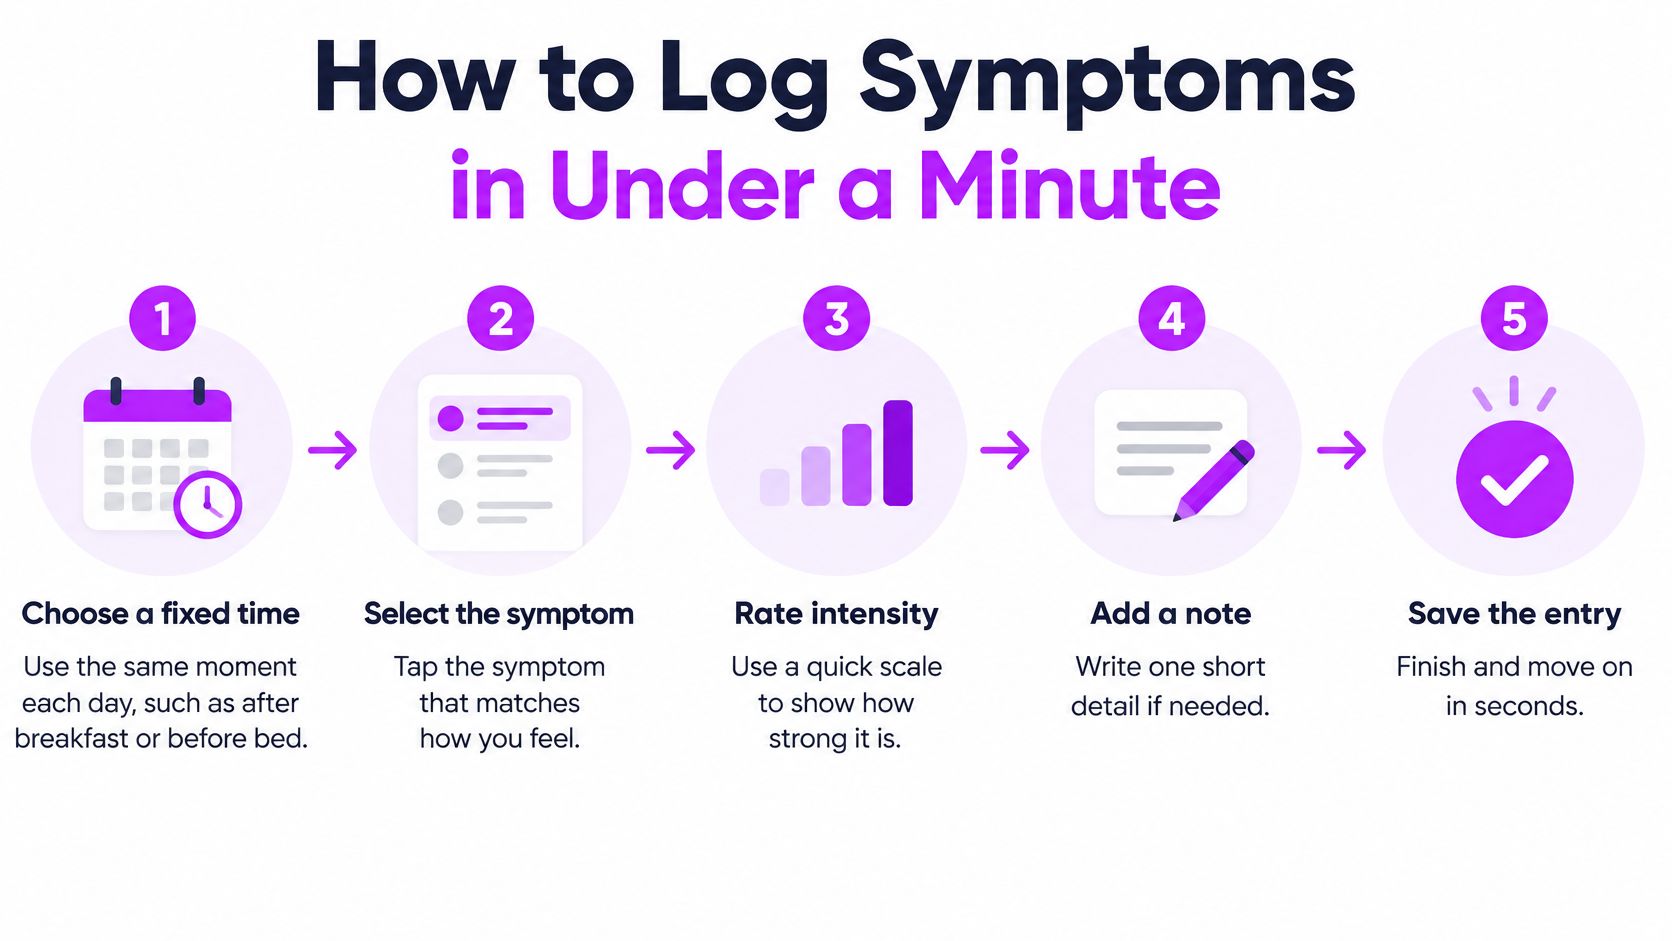
- Pick a fixed time. After breakfast or before bed, whichever you'll keep. A fixed point makes entries comparable; a random one makes timing patterns invisible.
- Choose the symptom from your list. Tap the saved name instead of typing. Adding a new symptom once is fine; retyping it daily is how people quit.
- Rate severity on your scale, including the zeros. A 0 is a data point and often the most useful one, because it marks the day a symptom stopped.
- Record when it started and how long it lasted. A four-hour ache peaking at 6 tells a different story from a 20-minute spike at 9, and duration often matters more to a clinician than the peak number.
- Add two or three context tags. Sleep hours, medication or dose, a skipped meal, an argument. Stop at three, because more turns the entry into a form.
- Write one short note if something was unusual. A single sentence, not a paragraph. Longer reflection belongs in a weekly review, when you're not mid-symptom.
- Review once a week in one sitting. Ten minutes, looking for repeated timing, repeated triggers, and the days you missed.
If you'd rather see the sequence once before building the habit, this walkthrough covers the same ground:
Three habits wreck a log. Logging only bad days tilts every average toward flares, because your good days vanish from the denominator. Changing the scale mid-month breaks the line. Writing long entries feels productive and is the fastest route to skipped days.
Speed isn't a shortcut either. In a 2020 feasibility study in patients with relapsed or refractory multiple myeloma, the nine participants who completed the study filled 30 of 36 scheduled weekly sessions, an adherence rate of 83%, in a group with a mean age of 69.7 years. A plain reporting workflow holds up even for people managing serious illness, which is the argument for keeping yours simple. In our app you can start journaling in under a minute, and short entries are the reason.
Why Gaps and Missed Days Distort Your Trends
You open the chart after a hard month and the line looks almost calm. Then you count the marks behind it: six entries across thirty days, none in the week you felt worst, two added after the fact. The shape is smooth because the record is thin.
A trend is only as good as its coverage. The trial analysis that reports the range puts app-based reporting completion at 42% to 82% and, in a 12-week randomized trial of 100 people with major depressive disorder using weekly smartphone assessments plus Fitbit-based passive monitoring, found 87% completed follow-up, median symptom-task completion was 75%, and wearable data were available for an average of 74 of 84 days. Even a funded study with prompts and devices can lose about a quarter of symptom entries.
Retention also slides. In the review of mood-monitoring research, adherence in one longitudinal intervention fell from 78% during weeks 1 to 4 to 47% by week 16. Early data arrives dense and later data turns intermittent, which is backwards from what you want, because later months are when slower patterns have time to show.
Before you trust a chart, including your own, check four things:
- Count the days behind every average. A mean severity of 5 built from four entries across 30 days is four days wearing a month's label.
- Distrust short windows with thin data. A seven-day trend drawn from two entries tells you almost nothing, and no line chart makes it denser than it is.
- Keep scheduled, skipped, and added days separate. A dose day you moved and a day you forgot are different events; mixing them manufactures associations that are not there. If your app supports skip and add overrides, use them so the calendar shows which is which.
- Treat a missed day as missing, never as a good day. A gap is not a zero, and an app that plots one is telling you something untrue.
More features do not fix this. Completion depends on how easy each entry is to finish; extra options mostly add more places to quit. That is part of why MicroTrack has no streaks and no XP: a streak counter converts a missed day into a failure, and the fastest way to protect a streak is to log something that did not happen.
Before you trust a chart: find the number of entries and the date range behind it. If the app will not show you both, treat the shape as decoration.
What PHQ-9 Scores Mean When You Use One
A 7 on your own scale means "worse than yesterday." A 7 on the PHQ-9 means something agreed on in advance, because the PHQ-9 is a nine-item screening questionnaire with published severity bands, and every score carries a shared meaning. It also asks about a two-week window, while your daily rating captures a moment. Treating the two as interchangeable is the most common confusion in mood tracking.
| Score range | Severity band | Suggested next step |
|---|---|---|
| 0-4 | No or minimal symptoms | Keep logging; the score alone calls for no action |
| 5-9 | Mild symptoms (subthreshold) | Keep logging and note any change from your previous score |
| 10-14 | Moderate symptoms (elevated) | Note the score and discuss it with a clinician |
| 15-19 | Moderately severe symptoms | Contact a clinician soon rather than waiting for the next scheduled entry |
| 20-27 | Severe symptoms | Contact a clinician promptly and follow any safety advice they give |
Read the bands as a prompt rather than a verdict. Scores below 10 sit in the subthreshold range, and 10 is the line where a screening result is generally treated as positive. In the lower bands, keep recording and watch the direction of travel, because one questionnaire score is noisy. From 10 to 14, note the score and the date and raise it at your next contact with a clinician. At 15 and above, call someone soon instead of waiting for the next scheduled entry.
A band tells you where a score sits. It can't tell you whether the score is moving. A 12 that was an 8 last month and a 12 that has held steady for a year call for different conversations, which is where a dated log earns its keep.
Where a tracker stops and a clinician starts
A journal can hold your questionnaire scores, chart them against your dose schedule, and show whether a change held for a month. It can't diagnose you from a personal mood rating. MicroTrack is a journaling tool, not a medical application, and it doesn't provide medical advice, diagnosis or treatment.
This is also why a mood log isn't evidence that a substance works. A systematic review of microdosing research found symptom improvements that weren't clearly distinguishable from placebo, with wide uncertainty around the estimates for mood, anxiety and stress. Keep logging your own ratings, and read them as a description of your weeks rather than proof of a mechanism.
What a PHQ-9 score does give you is shared vocabulary for an appointment. "Moderate, worsening over three months" lands differently than "I've been feeling off," and a dated score history makes that sentence easy to say accurately. If you want to see how validated measures sit alongside your own ratings, our guide to standardized assessment tools covers scores, bands and trends together.
Safety rule: if any answer points toward self-harm, contact local emergency services or a crisis line immediately rather than waiting for your next entry.
Turning Your Log Into a Clinician Summary
The evidence on whether tracking changes outcomes is mixed, and knowing that keeps you from overselling your own record. A 2025 analysis in the Journal of Medical Internet Research covers both sides: a randomized evaluation of a symptom communication aid in acute care found no evidence that it improved satisfaction with the patient-physician interaction or with care, even though patients and clinicians generally described its impact as beneficial. In a cancer study of 1,191 patients, electronic symptom reporting was associated with a 6.1% reduction in emergency visits, a 16% longer time to first emergency visit, and better quality-of-life outcomes. That same body of work found patients reported nearly twice as many symptoms as doctors identified, which is the argument for bringing a summary instead of trusting a conversation to surface everything.
The job is compression, not volume. One page, prepared before the visit, containing:
- Date range and coverage. "Six months, 112 entries, 61% of days" at the top.
- Average and peak severity per symptom. Two numbers, not a chart you narrate aloud.
- Timing patterns. Clusters by time of day or day of week, if you see them.
- Medications and dose changes, with dates. A shift in a chart usually lines up with a shift in dose.
- Functional impact. Missed work, broken sleep, cancelled plans. Clinicians act on function more readily than on a number.
Don't assume the log travels on its own. Many clinicians prefer that you bring the data to the appointment rather than having it pushed into their system, so export or print the summary beforehand and put your main question at the top of the page. Our guide to personal health records explains what to keep and how to hand it over.
Two guardrails. Alerts and notifications aren't emergency monitoring, so keep a crisis plan outside the app. And if checking has become compulsive, set one fixed weekly review time and leave the log alone between reviews; more checking produces more anxiety, not better data.
Confirm the Tracker Fits Before You Commit
Run a trial on yourself before committing to anything. Fourteen days is long enough to expose friction and short enough to abandon cheaply.
- Log one symptom daily on the scale you wrote down at the start. Same symptom, same scale, including the zero days.
- At day 14, count the days you missed and note why. A missed week because entry took four taps is a design problem, not a discipline problem.
- Build the one-page summary and time it. If it takes more than ten minutes, you won't do it before an early appointment.
- Check the privacy policy against the six questions. Encryption, sale, AI training, export, deletion, ownership.
- Decide to keep, switch or stop. All three are legitimate, and stopping beats maintaining a log nobody reads.
Then narrow by purpose. For a general symptom record tied to a condition, prioritise custom symptoms, searchable history and a clean export, because those three decide whether the record survives a clinic visit. For a mood-and-dose practice, a journal built around that rhythm fits better than a general health app. MicroTrack is one option to test, with a 10-point mood scale, dose details you can record in the moment and reflections you can add later, and it's free forever with no paywalls. Check its current features and scale yourself before committing. It's a journaling and tracking tool, not a medical application.
Whatever you pick, book the appointment and bring the fortnight's summary with you. Ask which questionnaire your clinician wants recorded between visits, then use that one from then on. That single question turns a private diary into a shared measurement.
MicroTrack gives you a calm place to record mood, dose, sensations and side effects on a 10-point scale, then review how they moved across weeks and months, with searchable history, CSV export and no streaks pushing you to log for the sake of a number. Entries are encrypted in transit and at rest, your journals are never sold, shared or used to train AI models, and you keep ownership of everything you write. Start at MicroTrack and give your next appointment something concrete to work with.